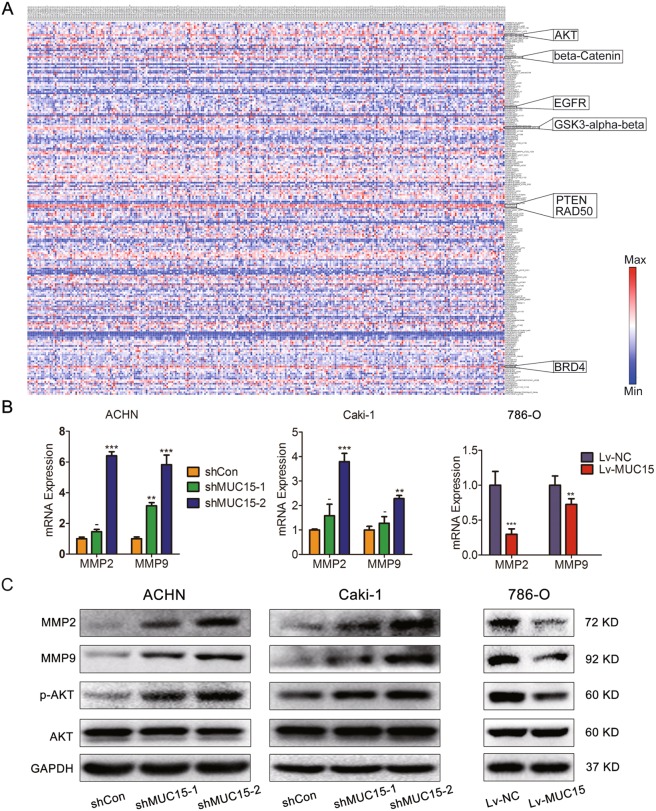
Fig. 4. Effects of MUC15 in PI3K/AKT signaling and MMPs expression.
a The heat map of protein expression of 278 RCC samples in TCGA database was analyzed and drawn by MORPHEUS. AKT, beta-Catenin, GSK3-alpha-beta, PTEN, RAD50, BRD4 protein expression level was elevated significantly in all tested proteins. b Real-time quantitative PCR analysis of MMP2 and MMP9 mRNA expression level in MUC15-KD ACHN and Caki-1 sublines, MUC15-OV 786-O sublines (N = 3). c Western blot analysis of MMP2, MMP9 and PI3K/AKT signaling in MUC15-KD ACHN and Caki-1 sublines, MUC15-OV 786-O sublines. 18S was applied as the endogenous control for quantitative real-time RT-PCR, and GAPDH was used as a loading control for western blotting assay (N = 3) (*P < 0.05, **P < 0.01, ***P < 0.001).

