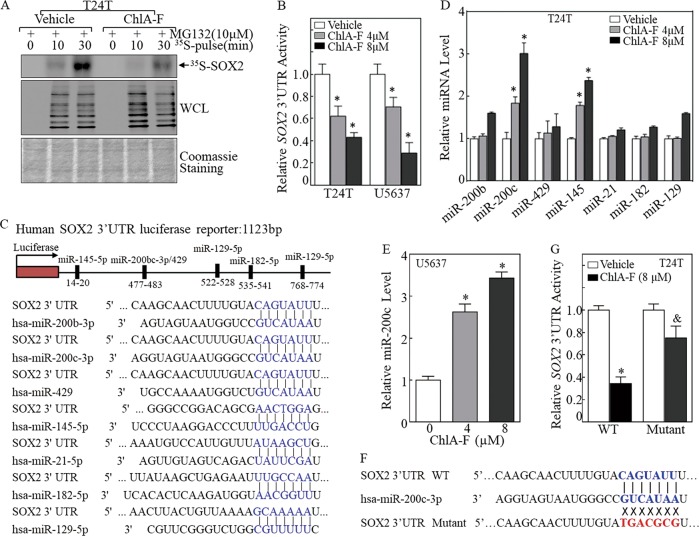
Fig. 4.
ChlA-F inhibits SOX2 protein translation by increasing miR-200c levels. a After treatment with or without ChlA-F (8 µM), T24T cells were treated with MG132 (10 µM) for 30 min. Newly synthesized SOX2 protein was monitored by a pulse assay using 35S-labeled methionine/cysteine. b A SOX2 3′-UTR-driven luciferase reporter and a TK reporter were transiently transfected into T24T cells treated with or without ChlA-F (4 or 8 µM). The luciferase activity of each transfectant was evaluated, and the bars show mean ± SD from three independent experiments. The asterisk (*) indicates a significant decrease compared with control transfectants (p < 0.05). c Potential microRNA binding sites in SOX2 mRNA 3′-UTR were predicted using the TargetScan, Pictar, and miRcode databases. d Quantitative real-time PCR was used to measure miRNA expression. The bars show mean ± SD from three independent experiments. The asterisk (*) indicates a significant increase in comparison with T24T control cells (p < 0.05). e Quantitative real-time PCR was employed to evaluate miR-200c expression in U5637 cells. The bars show mean ± SD from three independent experiments. The asterisk (*) indicates a significant increase in comparison with U5637 control cells (p < 0.05). f Schematic of the miR-200c binding sites and its mutant of the pMIR-report-SOX2 3′-UTR luciferase reporter. g Attenuation of ChlA-F inhibition of SOX2 mRNA 3′-UTR activity in the miR-200c binding site mutant of pMIR-report-SOX2 3′-UTR transfectants in comparison to ChlA-F inhibition of SOX2 mRNA 3′-UTR reporter activity in wild-type reporter transfectants. The asterisk (*) indicates a significant decrease in comparison with the vehicle control group. The symbol “&” indicates a significant difference between WT SOX2 3′UTR transfectant and Mutant SOX2 3′UTR transfectant upon ChlA-F treatment (p < 0.05)

