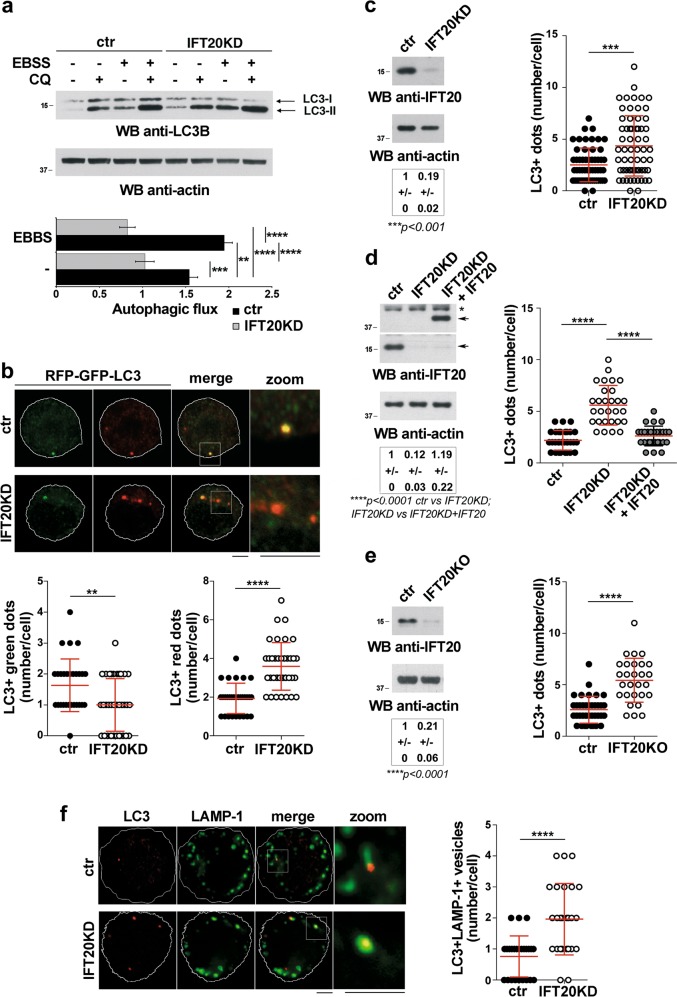
Fig. 1.
IFT20 is required for T cell autophagy. a Immunoblot analysis of the autophagy marker LC3B in lysates of ctr and IFT20KD Jurkat cells, either untreated or treated for 30 min with Earle’s starvation buffer (EBSS) in the presence or absence of chloroquine (CQ, 40 µM). The migration of molecular mass markers is indicated. The histogram below shows the autophagic flux in ctr and IFT20KD EBSS-untreated or EBSS-treated cells, calculated as the difference in the levels of LC3II (normalized to actin) between CQ-treated and CQ-untreated samples for each transfectant and condition (mean fold ± SD; normalized to vehicle control value in ctr cells set as 1, one-way ANOVA; n = 3). b Quantification of the number of GFP+ and RFP+ dots in ctr and IFT20KD Jurkat cells transiently transfected with the pmRFP-EGFP-rLC3 construct and labeled with anti-GFP and anti-RFP antibodies (≥10 cells/sample, n = 3; Mann–Whitney test). Representative images (median optical sections) are shown. Size bar, 5 μm. c–e Immunofluorescence analysis of LC3 in ctr and IFT20KD Jurkat cells (c), IFT20KD Jurkat cells transiently transfected with a construct encoding GFP-tagged IFT20 or control and IFT20KD cells transiently transfected with the respective GFP vector (d), or primary ctr and IFT20KO T cells (e). The graphs show the quantification of the number of LC3+ dots/cell (mean ± SD; (c, e) Mann–Whitney test (d) Kruskal–Wallis test). At least 30 cells from three independent experiments were analyzed. A representative anti-IFT20 immunoblot of the cells used is shown in each panel. Actin was used as loading control. The migration of molecular mass markers is indicated. The quantification of the relative protein expression normalized to actin (mean fold ± SD; ctr value = 1) is reported below each blot (n ≥ 3; (c, e) one sample t test, (d) ANOVA one-way test). f Immunofluorescence analysis of LC3 and LAMP-1 in ctr and IFT20KD Jurkat cells. Quantification of the number of autolysosomes (LC3+LAMP-1+ vesicle number/cell) in ctr and IFT20KD Jurkat cells (mean ± SD; Mann–Whitney test). At least 25 cells from three independent experiments were analyzed. Representative images (medial optical sections) are shown. Size bar: 5 μm. **P < 0.01; ***P < 0.001; ****P < 0.0001

