Fig. 6.
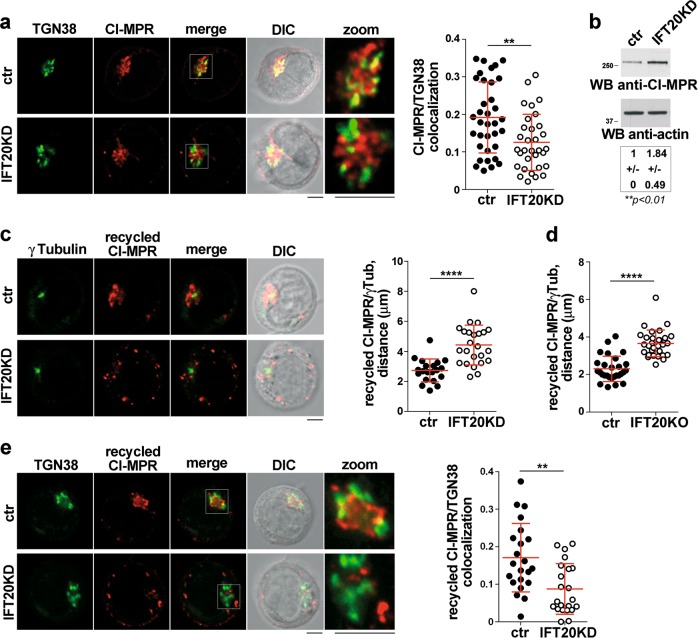
IFT20 controls the retrograde transport of CI-MPR to the TGN. a Quantification using Mander’s coefficient of the weighted colocalization of CI-MPR and the trans-Golgi marker TGN38 in ctr and IFT20KD Jurkat cells (≥10 cells/sample, n ≥ 3). Representative images (medial optical sections) are shown. Size bar: 5 μm. The data are expressed as mean ± SD (Mann–Whitney test). b Immunoblot analysis with anti-CI-MPR antibody of lysates from ctr and IFT20KD Jurkat cells. Actin was used as loading control. The migration of molecular mass markers is indicated. The quantification of CI-MPR expression, normalized to actin (mean fold ± SD; ctr value = 1), is reported below (n = 6; one sample t test). c, d Immunofluorescence analysis of CI-MRP recycling in control and IFT20KD Jurkat cells (c), or primary ctr and IFT20KO T cells (d), incubated with saturating concentrations of receptor-specific mAb at 37 °C for 60 min (Jurkat cells) or 4 h (primary T cells). The histograms show the quantification of the distance between CI-MRP+ vescicles and γ-tubulin in medial confocal sections (panel c: at least 20 cells from three independent experiments were analyzed, Student’s t test; panel d: at least 28 cells from three independent experiments were analyzed, Mann–Whitney test). e Immunofluorescence analysis of ctr and IFT20KD Jurkat treated as in (c) and stained with anti-TGN38 mAb. The histogram shows the quantification of Mander’s colocalization coefficient between CI-MRP+ vesicles and TGN38 in medial confocal sections of control or IFT20KD Jurkat cells 60 min after antibody-induced CI-MPR internalization. At least 22 cells from three independent experiments were analyzed (Mann–Whitney test). Representative images are shown. Size bar: 5 μm. **P < 0.01; ****P < 0.0001

