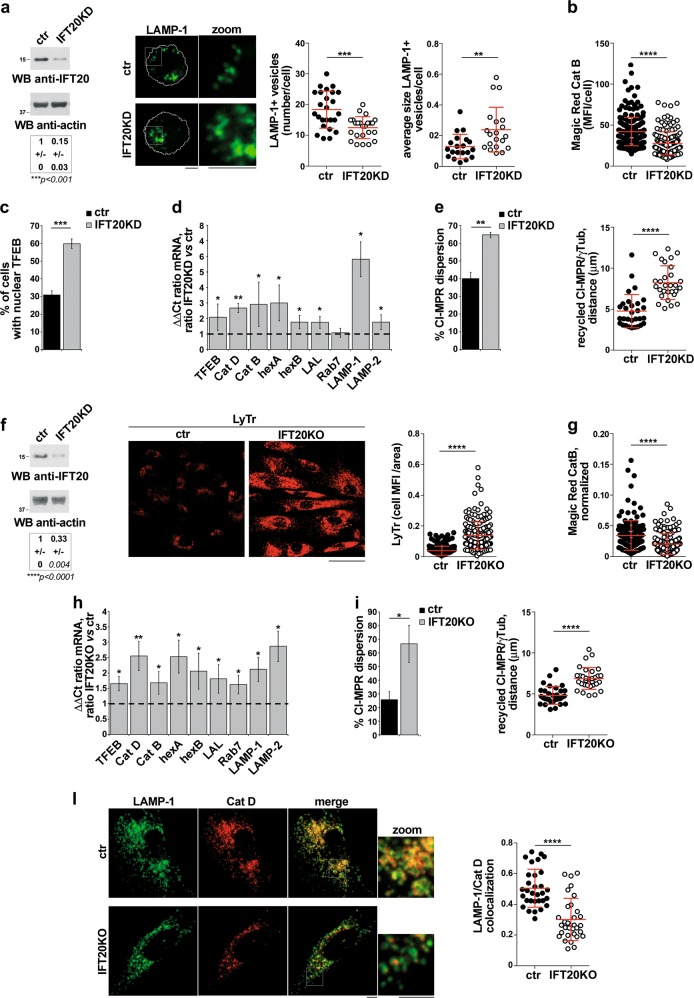
Fig. 8.
IFT20 controls lysosome biogenesis in non-ciliated and ciliated cells. a Representative anti-IFT20 immunoblot of lysates of ctr and IFT20KD MEC1 B cells. Actin was used as loading control. The migration of molecular mass markers is indicated. The quantification of the relative protein expression, normalized to actin (mean fold ± SD; ctr value = 1), is reported below (n = 3; one sample t test). Right, Immunofluorescence analysis of LAMP-1 in ctr and IFT20KD MEC1 B cells. The graphs show the quantification of the number and average size (µm2) of LAMP-1+ vesicles/cell (mean ± SD, Mann–Whitney test). At least 20 cells from three independent experiments were analyzed. b Immunofluorescence analysis of control and IFT20KD MEC1 cells loaded 4 h at 37 °C with Magic red (1 µM). The histograms show the quantification of mean fluorescence intensity/cell (MFI/cell) (mean ± SD; ≥50 cells/sample, n = 3; Mann–Withney test). c Quantification of nuclear GFP-tagged TFEB in ctr and IFT20KD MEC1 cells (mean ± SD; n = 3; Student’s t test). d Quantitative RT-PCR analysis of TFEB-regulated genes and TFEB in control and IFT20KD MEC1 cells. The relative abundance of gene transcripts was determined on triplicate samples using the ddCt method and was normalized to HPRT1. The data (mean ± SD; n ≥ 3; one sample t test) are expressed as normalized fold expression in IFT20KD vs control vs cells (expression in ctr cells set for each gene as 1, dashed line). e Immunofluorescence analysis of CI-MRP recycling in control and IFT20KD MEC1 cells, incubated with saturating concentrations of receptor-specific mAb at 37 °C for 60 min and stained with anti-γ-tubulin antibodies. Left, Quantification of the percentage of CI-MRP dispersion in control and IFT20KD MEC cells, calculated as percentage of cells where more than 40% of CI-MRP+ vesicles are distant more than 2.5 µm from the centrosome in individual medial confocal sections (mean ± SD, n = 3; Student’s t test). Right, Quantification of the distance between CI-MRP+ vescicles and γ-tubulin in medial confocal sections of control or IFT20KD MEC1 cells (mean ± SD; n = 3; Mann–Withney test). f Representative anti-IFT20 immunoblot of lysates of ctr and IFT20KD hTERT fibroblasts transiently knocked out for IFT20 expression by CRISPR/Cas9 gene editing. Actin was used as loading control. The migration of molecular mass markers is indicated. The quantification of the relative protein expression, normalized to actin (mean fold ± SD; ctr value = 1), is reported below (n = 3; one sample t test). Right, Immunofluorescence analysis of control and IFT20KO hTERT fibroblasts loaded 10 min at 37 °C with Lysotracker red (LyTr, 75 nM). Median optical sections are shown. Size bar: 50 µm. The graphs show the quantification of the mean fluorescence intensity (MFI)/cell normalized to the cell area (mean ± SD; ≥35 cells/sample, n = 5; Mann–Whitney test). g Immunofluorescence analysis of control and IFT20KO hTERT fibroblasts loaded 4 h at 37 °C with Magic Red (1 µM). The graphs show the quantification of cell MFI/area normalized to the Lysotracker MFI (right) in ctr and IFT20KO cells (mean ± SD; ≥29 cells/sample, n = 5; Mann–Whitney test). h Quantitative RT-PCR analysis of TFEB-regulated genes and TFEB in control and IFT20KO hTERT fibroblasts gene-edited by CRISPR-Cas9 technology (n ≥ 3; one sample t test). The relative abundance of gene transcripts was determined on triplicate samples using the ddCt method and was normalized to HPRT1. The data (mean ± SD) are expressed as normalized fold expression in IFT20KO vs control cells (expression in ctr cells set for each gene as 1, dashed line). i Immunofluorescence analysis of CI-MRP recycling in control and IFT20KO hTERT fibroblasts, incubated with saturating concentrations of receptor-specific mAb at 37 °C for 4 h and stained with anti-γ-tubulin antibodies. Left, the data are quantified as the percentage of CI-MRP dispersion (mean ± SD), calculated as percentage of cells where at least 40% of CI-MRP+ vesicles are distant more than 2.5 µm from the centrosome in individual medial confocal sections (mean ± SD; n = 3; Student’s t test). Right, quantification of the distance between CI-MRP+ vescicles and γ-tubulin in medial confocal sections of control or IFT20KO hTERT fibroblasts (mean ± SD; ≥31 cells, n = 3; Mann–Whitney test). l Quantification using Mander’s coefficient of the weighted colocalization of LAMP-1 and catD (Abcam antibody) in ctr and IFT20KO hTERT fibroblasts (≥10 cells/sample, n = 3). Representative images (medial optical sections) are shown. Size bar: 5 μm. The data are expressed as mean ± SD (Mann–Whitney test). *P < 0.05; **P < 0.01; ***P < 0.001; ****P < 0.0001

