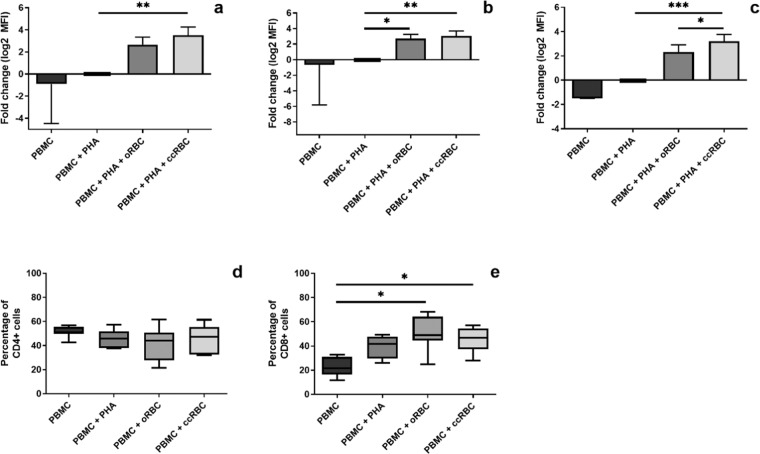
Figure 3.
PBMC proliferation with RBC treatment. Figures represent proliferation of (a) CD3 + cells, (b) CD4 + cells, and (c) CD8 + cells from a PBMC population as fold change of proliferation from loss of CFSE fluorescence (MFI), and percentage of (d) CD4 + cells or (e) CD8 + cells in a CD3 + population of PBMCs following treatment with nothing (PBMC), with PHA-P (PBMC + PHA), with PHA-P and oRBCs (PBMC + PHA + oRBC), or with PHA-P and ccRBCs (PBMC + PHA + ccRBC). Proliferation index presented as mean ± SD and percentages presented as box and whisker plots with median (n ≥ 6). PBMCs were analysed by flow cytometry after 5 days in culture at 37 °C with 5% CO2. Data are statistically significantly different if *p < 0.05, **p < 0.01, or ***p < 0.001.

