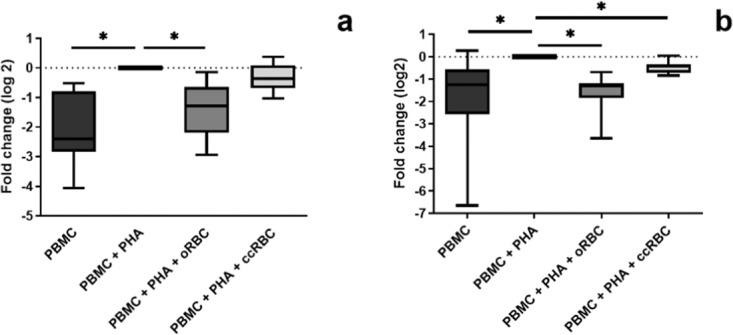
Figure 5.

Expression of transcription factors in T-cells following RBC treatment. Expression of transcription factors in CD8+ population of PBMCs following treatment with nothing (PBMC), with PHA-P (PBMC + PHA), with PHA-P and oRBCs (PBMC + PHA + oRBC), or with PHA-P and ccRBCs (PBMC + PHA + ccRBC) after 5 days in culture at 37 °C and 5% CO2 (median ± min/max, n = 7). Data are presented as fold change from PBMCs treated with PHA-P in expression of (a) GATA-3 and (b) T-bet. Data are statistically significantly different from PBMCs + PHA if *p < 0.05.
