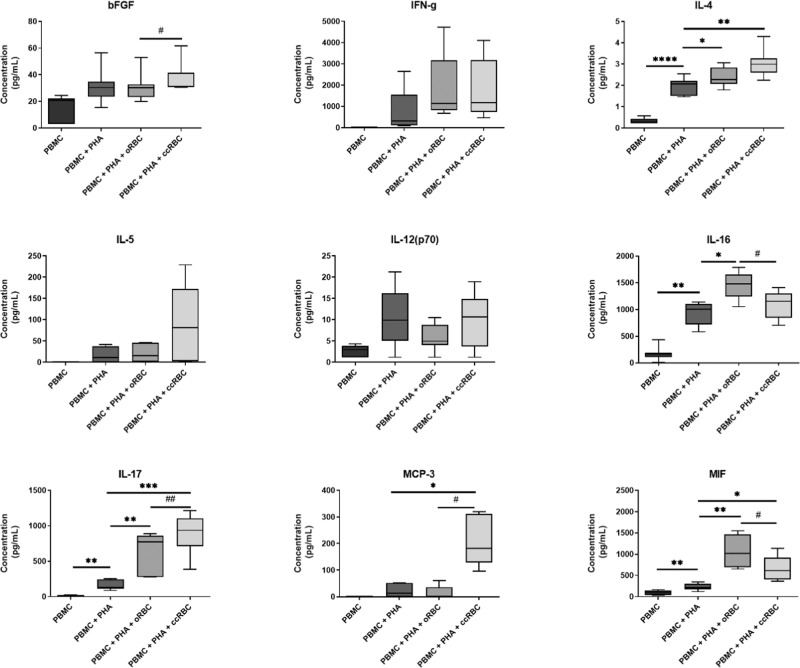
Figure 6.
Secretion of cytokines from PBMCs following RBC treatment. Summary of cytokines in PBMC conditioned media from untreated PBMCs (PBMC), PBMCs treated with PHA-P (PBMC + PHA), PBMCs treated with PHA-P and oRBCs (PBMC + PHA + oRBC), and PBMCs treated with PHA-P and ccRBCs (PBMC + PHA + ccRBC) as measured by Bio-Plex. Data are presented as box and whisker plots with median concentration (n = 5). Data are statistically significantly different from PBMCs treated with PHA-P if *p < 0.05, **p < 0.01, ***p < 0.001, or ****p < 0.0001 and PBMC + PHA + oRBCs are statistically significantly different from PBMC + PHA + ccRBCs if #p < 0.05.

