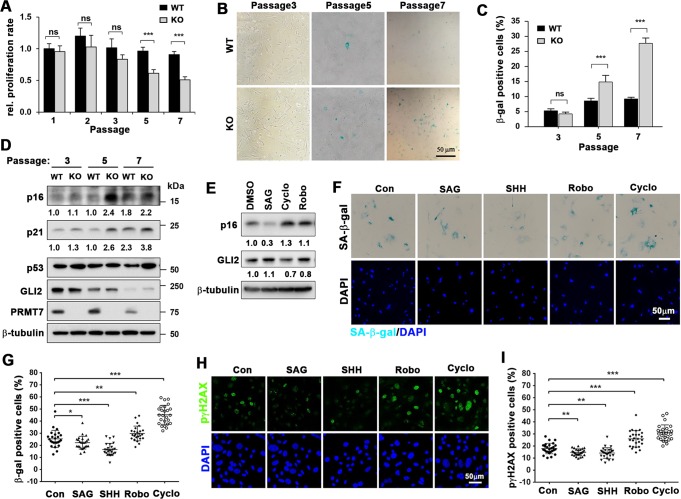
Fig. 1.
PRMT7 deficiency leads to premature cellular senescence of MEFs. a Relative proliferative capacity of WT and KO MEFs cells during cell passaging. The cell number of the first passage WT cells was set to 1.0. The determinants represent the means ± SEM. n = 3. ns = not significant, ***P < 0.001. The experiment was performed at least three times with similar results. b Staining for senescence-associated β-galactosidase activity (SA-β-gal) with MEFs at cell passage number 3, 5, and 7 (p3, p5, and p7). Size bar = 50 μM. c SA-β-gal positive cells were counted and plotted as percentile. Cells in at least 6 random areas were analyzed and performed with 3 different MEF batches. Data are presented as mean ± SEM. ANOVA test for comparison with the control cells. ***P < 0.001. d Immunoblot analysis for senescence-associated proteins such as p53, p21, and p16, and β-tubulin used as a loading control. The relative levels of p16 and p21 are listed below and the relative signal intensity to the loading control of WT cells at p3 was set to 1.0. e Immunoblot analysis for p16 and GLI2 in WT MEFs at p5 treated with SAG or two Shh antagonists, cyclopamine (Cyclo) or robotnikinin (Robo) for 48 h. The relative signal intensity to the loading control from vehicle treated cells was set to 1.0. f Staining for SA-β-gal of MEFs at p7 treated with vehicle, SAG, Shh, Robo, or Cyclo for 48 h. Size bar = 50 μM. g SA-β-gal positive cells were counted and plotted as percentile. Data are presented as mean ± SEM. ANOVA test for comparison with the control cells. n = 25 fields for each condition. *P < 0.05, **P < 0.01, ***P < 0.001. h Immunostaining for a DNA damage marker p-γH2AX of MEFs at p7 treated with vehicle, SAG, Shh, Robo, or Cyclo for 48 h. Size bar = 50 μM. i Quantification of p-γH2AX-positive cells. Data are presented as mean ± SEM. ANOVA test for comparison with the control cells. n = 26 fields for each condition. **P < 0.01, ***P < 0.001

