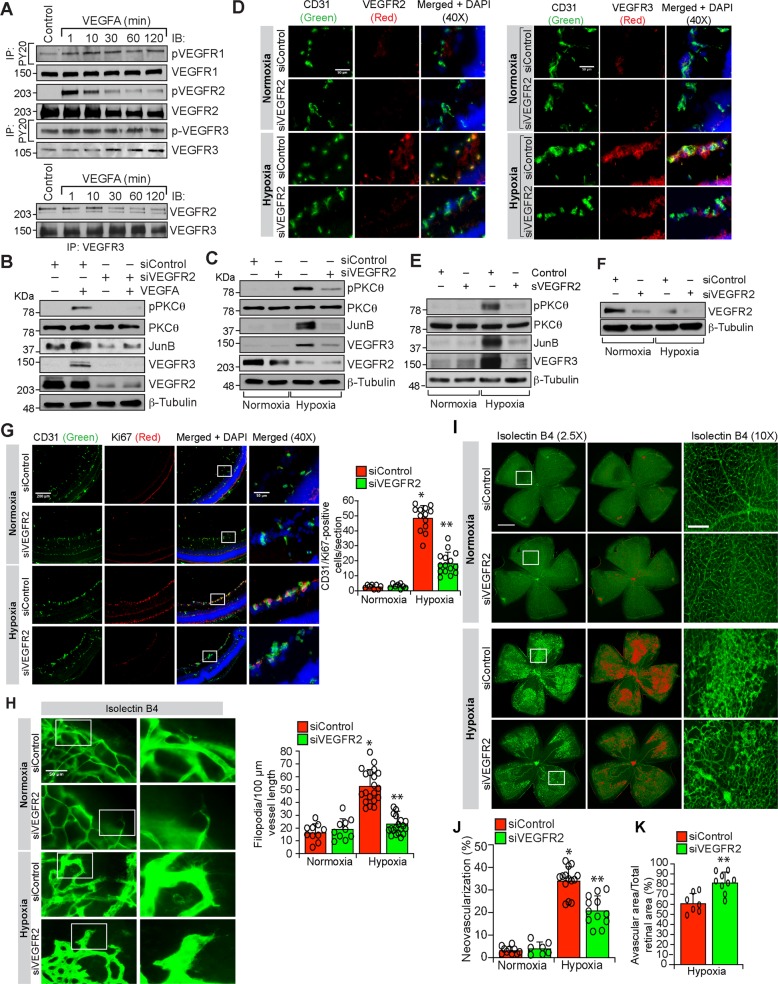
Fig. 7. Depletion of VEGFR2 levels blunts retinal neovascularization.
a Upper panel: Equal amount of protein from control and the indicated time periods of VEGFA-treated HRMVECs were analyzed for phospho and total VEGFR1, 2 and 3 levels. Lower panel: The cell extracts were analyzed for VEGFR2 and VEGFR3 complex formation. b HRMVECs were transfected with siControl or siVEGFR2 (100 nM), quiesced, treated with and without VEGFA (40 ng/ml) for 10 min (for pPKCθ) or 120 min (for JunB and VEGFR3) and cell extracts were prepared and analyzed by western blotting for the indicated proteins. c Retinas from normoxic and 24 h (i.e., at P13) of hypoxic WT mice pups that received siControl or siVEGFR2 (1 μg/0.5 μl/eye) by intravitreal injections at P10 and P11 were isolated, extracts were prepared and analyzed by western blotting for the indicated proteins. d Eyes from normoxic and 72 h (i.e., at P15) of hypoxic WT mice pups that received siControl or siVEGFR2 (1 μg/0.5 μl/eye) by intravitreal injections at P11, P12 and P13 were enucleated, fixed, sections were made and coimmunostained for CD31 and VEGFR2 (left panel) and CD31 and VEGFR3 (right panel). e Eyes from normoxic and 24 h (i.e., at P13) of hypoxic WT mice pups that were injected intravitreally with vehicle or 0.05 μg/0.5 μl/eye of soluble VEGFR2 at P11 and P12 were enucleated, retinas were isolated, protein extracts were prepared and analyzed by western blotting for the indicated proteins using their specific antibodies. f Eyes from normoxic and 24 h of hypoxic mice pups that were injected intravitreally with siControl or siVEGFR2 (0.5 μg/0.5 μl/eye) at P11 and P12 were enucleated, retinas were isolated, protein extracts were prepared and analyzed by western blotting for VEGFR3 levels using its specific antibodies and the blot was normalized for β-tubulin. g All the conditions were the same as in (d) except that sections were coimmunostained for CD31 and Ki67. The bar graph shows quantification of proliferating ECs per section. h All the conditions were the same as in (d) except that eyes were enucleated at P17, fixed, retinas were isolated, stained with isolectin B4, flat mounts were made and examined for filopodia at 40× magnification (scale bar, 50 μm). Bar graph shows quantification of the number of filopodia/unit vessel length. i All the conditions were the same as in (h) except that the flat mounts were examined for retinal vascularization. Retinal vascularization is shown in the first column at 2.5× magnification (scale bar, 500 μm). Neovascularization is highlighted in red in the second column. The third column shows the selected rectangular areas of the images in the first column at 10× magnification (scale bar, 200 μm). j,k Retinal neovascularization (j) and avascular area (k) were determined as described in “Materials and Methods.” The values are presented as mean ± SD. *p < 0.01 vs normoxia; **p < 0.01 vs siControl + hypoxia.

