Fig. 3.
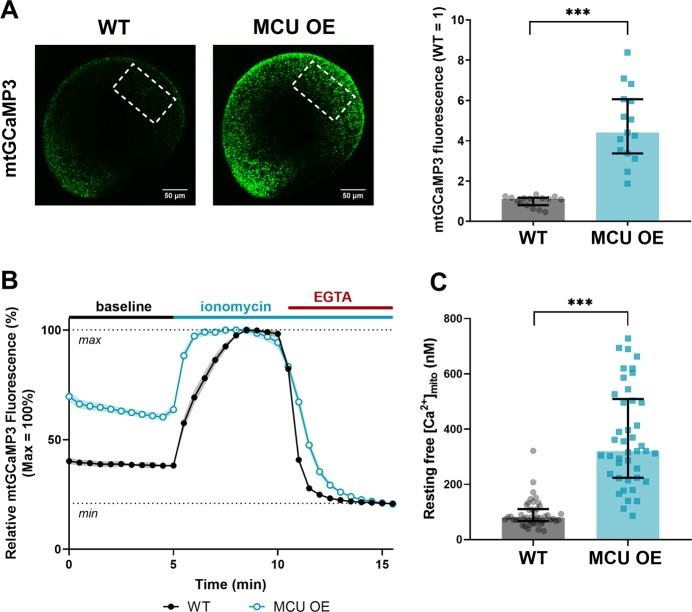
Overexpression of MCU in cones raises basal [Ca2+] in the mitochondrial matrix. a Total cone mitochondria clusters in a larval zebrafish eye expressing gnat2:mito-GCaMP3, a mitochondrial Ca2+ sensor (green). Dotted outlines demarcate the region of the eye used for fluorescence quantification. The median is reported with bars = interquartile range, n = 15 larvae for both WT and MCU OE. ***p < 0.001 using Mann–Whitney test. b Relative mito-GCaMP3 fluorescence of cone mitochondrial clusters in adult retinal slices of gnat2:mito-GCaMP3 fish (WT or MCU OE) collected between 3 and 4 months of age. Baseline fluorescence was first assayed in the presence of KRB buffer containing 2 mM CaCl2, then ionomycin (5 µM) was added to the slice to allow 2 mM Ca2+ entry into the mitochondria to saturate the probe. Next, EGTA (5 mM) was added to the solution (keeping [ionomycin] constant) to chelate Ca2+ and establish the minimum GCaMP3 fluorescence signal. n = 45 mitochondrial clusters (three fish) for WT and n = 42 mitochondrial clusters (three fish) for MCU OE. Slices were imaged every 30 s. The mean is reported and shaded region = standard error. c Approximation of resting free [Ca2+] in mitochondria clusters assayed in B using the equation , where . We used the previously reported KD of GCaMP3 (345 nM, from ref. 23) as an approximation for our calculation. Reporting the median with bars = interquartile range and ***p < 0.001 using Mann–Whitney test

