Fig. 7.
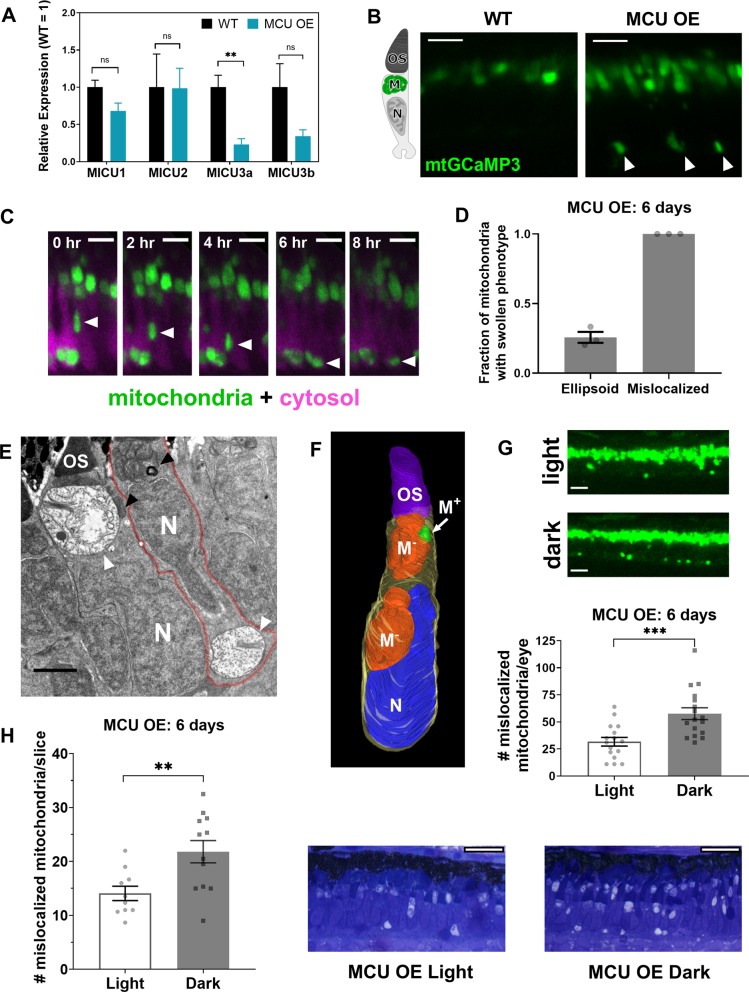
Cones respond to MCU overexpression by decreasing MICU3 transcript and selectively transporting abnormal mitochondria away from the ellipsoid. a qRT-PCR quantification of relative mRNA of MICU proteins (relative to reference gene Ef1α, see “Methods”) between WT and MCU OE retinas at 3 months of age (n = 3). The mean is reported and bars = standard error. **p < 0.01 and ns = not significant using Welch’s t-test. b Cone mitochondrial clusters in live larvae expressing gnat2:mito-GCaMP3. WT mitochondria were imaged with higher laser power to show localization. In MCU OE models, mitochondrial clusters were found near the synapse and nuclear layer (white arrows), which was not observed in WT siblings. Left: cone schematic with OS = outer segment, M = mitochondrial cluster, and N = nucleus. Scale bar = 5 µm. c 8 h timelapse of a migrating mitochondrial cluster (green, white arrow) in live MCU OE gnat2:mito-GCaMP3 larvae. Cone cell bodies express cytosolic RFP (magenta). Scale bar = 5 µm. d Quantification of cone mitochondria in WT sibling and MCU OE fish from EM images of whole zebrafish larval eyes (single slice at optic nerve) at 6 days of age. Fraction of swollen mitochondria was determined by counting swollen mitochondria relative to total cone mitochondria either in the ellipsoid or mislocalized. n = 3 larvae for both WT and MCU OE fish. The mean is reported and bars = standard error. e EM image from MCU OE larvae at 14 days of age. A single cone photoreceptor can contain both healthy mitochondria (black arrows) in the ellipsoid region and swollen mitochondria (white arrows) near the synapse. Cone cell membrane outlined in red overlay to aid visualization. Scale bar = 2 µm. OS = outer segment, N = nucleus. f 3D reconstruction of an MCU OE cone from a 6-day-old fish using serial block-face EM (synapse not shown). Electron-lucent mitochondria (M−) displace the nucleus (N) of the cone to move toward the synapse region. OS = outer segment. M− = electron-lucent mitochondria. M+ = healthy mitochondria. N = nucleus. Outline (yellow) = cell body. g Quantification of mislocalized mitochondria using the mito-GCaMP3 probe in 6-day-old MCU OE fish under a normal light cycle or subjected to constant darkness at 5 days of age. Quantification was performed across a whole eye at a total depth of 50 µm. Scale bar = 10 µm. ***p < 0.001 using Welch’s t-test (n = 16 fish each). h Quantification of mislocalized mitochondria in Richardsons’-stained sections of 6-day-old fish under a normal light cycle or subjected to constant darkness at 5 days of age. Quantification was performed in 2–3 slices per eye at/near the optic nerve and the average # of mitochondria for each eye is reported. Scale bar = 25 µm. **p < 0.01 using Welch’s t-test (n = 10 eyes in light, 12 eyes in dark)

