Fig. 4.
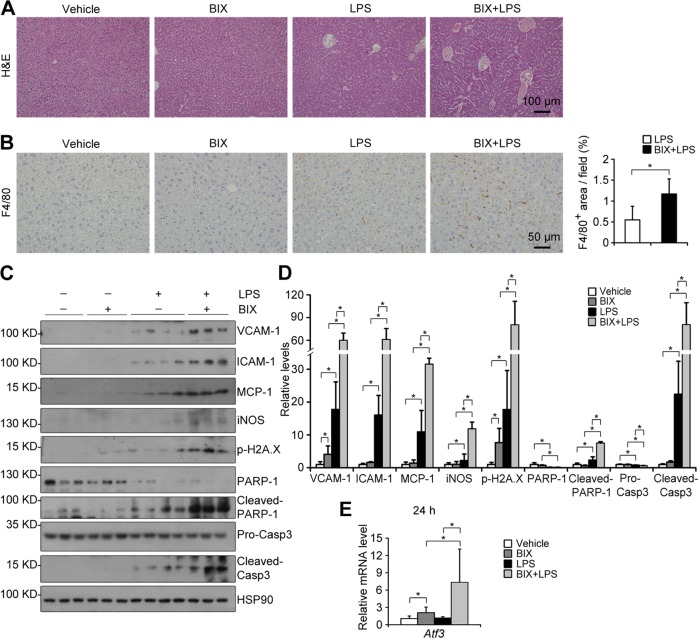
Inhibiting G9a methyltransferase activity deteriorates LPS-induced liver damage. a, b Representative pictures for H&E staining (a; scale bar, 100 μm); and F4/80 staining (b, left; scale bar, 50 μm) with quantitative results (b, right) in the liver. c, d Representative western blots (c) and quantitative results (d) of indicated proteins in livers of different groups. HSP90 serves as the loading control. e Relative mRNA level of Atf3 in the liver at 24 h after LPS injection. n = 3–4 per group; *p < 0.05

