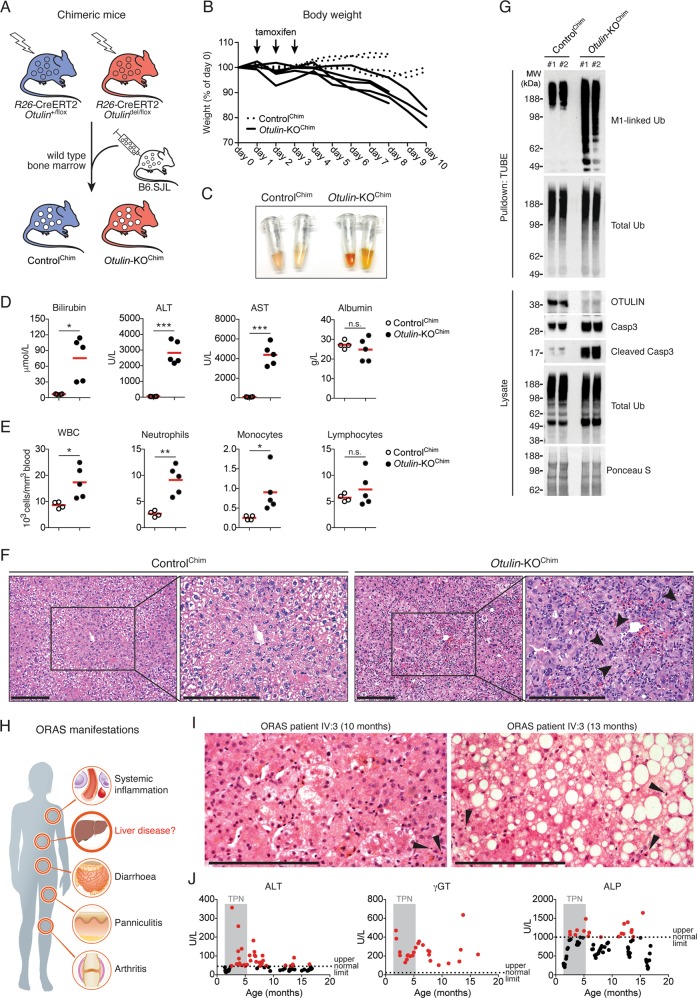
Fig. 1. Liver disease in mice and humans deficient in OTULIN.
a Schematic representation of wild type B6.SJL bone marrow transplantation into γ-irradiated Rosa26-Cre-ERT2-Otulin (R26-Cre-ERT2-Otulin) mice. b Relative body weight following i.p. administration of tamoxifen (arrows) to ControlChim (n = 4) and Otulin-KOChim (n = 5) mice. Each line represents one mouse. Data were pooled from two independent experiments. c Serum from terminal bleeds of ControlChim and Otulin-KOChim mice at the end of the experiment shown in (b). d, e Analysis of bilirubin, ALT, AST, and albumin levels in serum (d) and blood cell counts (e) from terminal bleeds of ControlChim (n = 4) and Otulin-KOChim (n = 5) mice at the end of the experiment shown in (b). Data were pooled from two independent experiments. Data are presented as individual data points, each representing one mouse. Red bars indicate means. Data were analysed using an unpaired, two-sided Student’s t test. n.s., non-significant. f Micrographs of H&E stained liver sections from ControlChim and Otulin-KOChim mice at the end of the experiments shown in (b). Arrowheads indicate cells with nuclear condensation and fragmentation. Micrographs are representative of two mice in each group. g Immunoblot analysis of whole-liver lysates and endogenous Ub conjugates purified by TUBE pulldown from livers of two ControlChim and two Otulin-KOChim mice at the end of the experiment shown in (b). h Schematic representation of the clinical manifestations of ORAS. i Micrographs of H&E stained liver sections from an ORAS patient at the age of 10 and 13 months. Arrowheads indicate apoptotic cells. j Analysis of ALT, γGT, and ALP levels in plasma from the ORAS patient shown in (i). Grey shading indicates period of TPN feeding. Dotted lines indicate upper normal limits of the test. Each data point represents individual measurements, and red data points are above the upper normal limits. See also Fig. S1.

