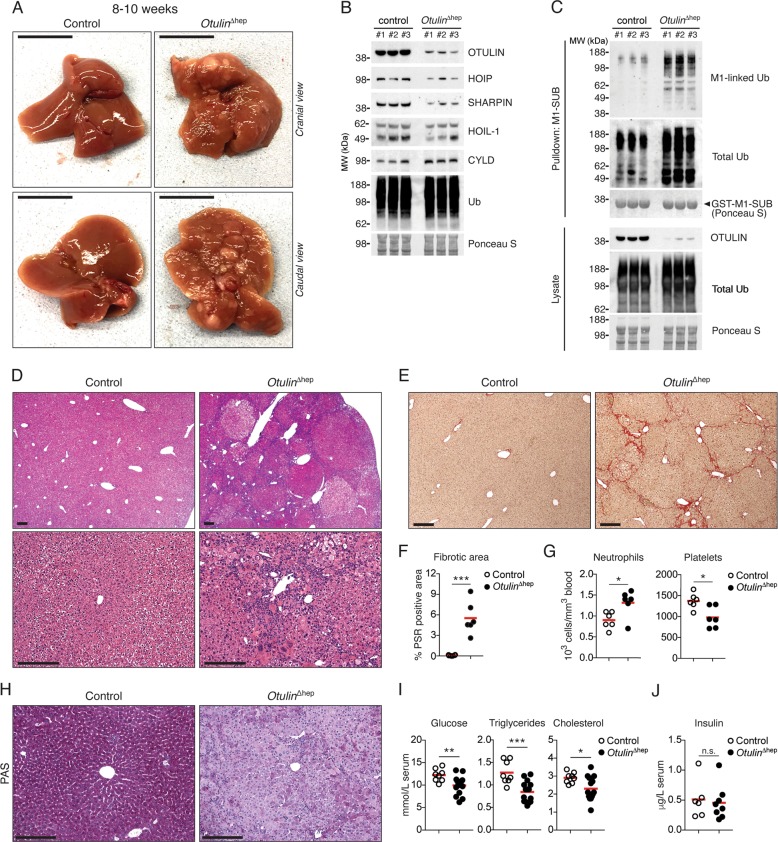
Fig. 2. Steatohepatitis, fibrosis, and spontaneous tumour formation in Otulin∆hep mice.
a Representative macroscopic appearance of Otulin∆hep and control livers at the age of 8–10 weeks. Scale bars indicate 1 cm. b Immunoblot analysis of OTULIN, LUBAC, and CYLD expression in whole-liver lysates from three Otulin∆hep and three control mice aged 8–10 weeks. c Immunoblot analysis of whole-liver lysates and endogenous Ub conjugates purified by M1-SUB pulldown from livers of three control and three Otulin∆hep mice. d Micrographs of H&E stained liver sections from Otulin∆hep and control mice aged 8–10 weeks. Top panels show pale-staining hepatocyte clones with fat accumulation in Otulin∆hep mice. Bottom panels show inflammation, fat accumulation, and variations in nuclear size in Otulin∆hep livers. Micrographs are representative of eight mice of each genotype. e Micrographs of PSR stained liver sections from Otulin∆hep and control mice aged 8–10 weeks show fine bridging porto-portal and porto-central fibrous septa with areas of pericelluar fibrosis in Otulin∆hep mice. Micrographs are representative of six mice of each genotype. f Quantification of PSR-positive (fibrotic) area in liver sections from Otulin∆hep (n = 6) and control (n = 6) mice aged 8–10 weeks. g Neutrophil and platelet counts from terminal bleeds of Otulin∆hep (n = 6) and control (n = 6) mice aged 8–10 weeks. h Micrographs of PAS stained liver sections from Otulin∆hep and control mice aged 8–10 weeks show pale-staining hepatocytes in Otulin∆hep mice due to loss of glycogen. Micrographs are representative of five controls and six Otulin∆hep mice. i, Analysis of glucose, triglyceride, and cholesterol levels in serum from terminal bleeds of Otulin∆hep (n = 15) and control (n = 8) mice aged 8–10 weeks. j Analysis of insulin levels in serum from terminal bleeds of Otulin∆hep (n = 8) and control (n = 6) mice aged 8–10 weeks. f, g, i, j Data are presented as individual data points, each representing one mouse. Red bars indicate means. Data were analysed using an unpaired, two-sided Student’s t test. n.s., non-significant. See also Fig. S2.

