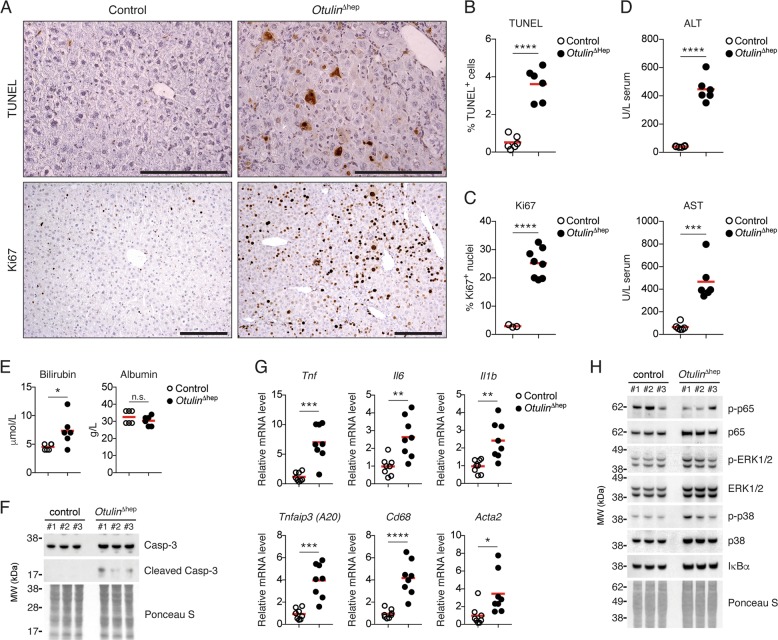
Fig. 3. Liver disease in Otulin∆hep mice is associated with hepatocyte cell death, proliferation, and inflammation.
a TUNEL (top panels) and anti-Ki67 (bottom panels) stainings of liver sections from Otulin∆hep and control mice aged 8–10 weeks. Data are representative of six mice of each genotype for TUNEL staining and three controls and eight Otulin∆hep mice for Ki67. b, c Quantification of TUNEL- (b) and Ki67-positive (c) cells in liver from Otulin∆hep and control at the age of 8–10 weeks as shown in (a). TUNEL (b), Otulin∆hep (n = 6) and control (n = 6), and anti-Ki67 (c), Otulin∆hep (n = 8) and control (n = 3). d, e Analysis of ALT and AST (d) or bilirubin and albumin (e) levels in serum from terminal bleeds of Otulin∆hep (n = 6) and control (n = 6) mice aged 8–10 weeks. f Immunoblot analysis of caspase-3 cleavage in whole-liver lysate from livers of three control and three Otulin∆hep mice aged 8–10 weeks. g Relative mRNA expression of Tnf, Il6, Il1b, Tnfaip3, Cd68, and Acta2 in livers from Otulin∆hep (n = 8) and control (n = 8) aged 8–10 weeks measured by quantitative RT-PCR. h Immunoblot analysis of NF-κB p65/RelA and MAP kinase activation in whole-liver lysate from livers of three control and three Otulin∆hep mice aged 8–10 weeks. b–e, g Data are presented as individual data points, each representing one mouse. Red bars indicate means. Data were analysed using an unpaired, two-sided Student’s t test. n.s., non-significant. See also Fig. S3.

