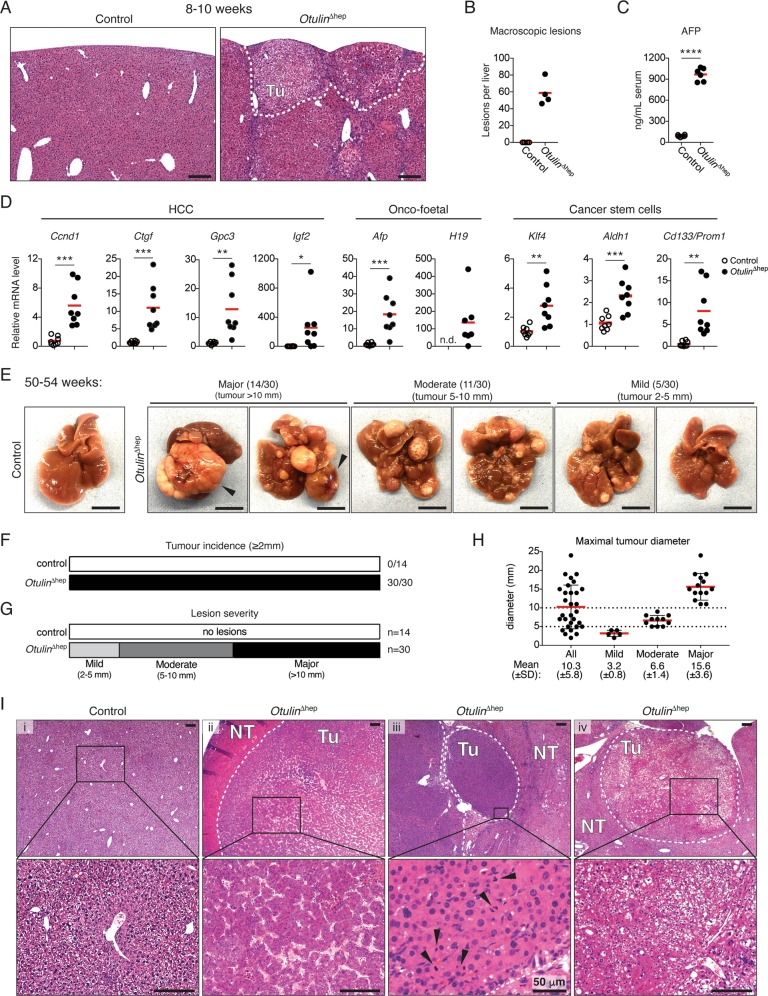
Fig. 4. Hepatocellular carcinoma in Otulin∆hep mice.
a Micrographs of H&E stained liver sections from Otulin∆hep and control mice aged 8–10 weeks. The dotted line indicates two subcapsular tumours. Micrographs are representative of eight mice of each genotype. Tu, tumour. b Quantification of the number of macroscopically discernible lesions (tumours, nodules, and discolourations) in Otulin∆hep and control mice aged 8–10 weeks. Data are representative of four mice of each genotype. c Analysis of AFP levels in serum from terminal bleeds of Otulin∆hep (n = 6) and control (n = 6) mice aged 8–10 weeks. d Relative mRNA expression of the indicated cancer markers in livers from Otulin∆hep (n = 8) and control (n = 8) aged 8–10 weeks measured by quantitative RT-PCR. e Representative macroscopic appearance of Otulin∆hep and control livers at the age of 50–54 weeks, grouped by severity. Arrowheads indicate highly vascularised tumours. Scale bars indicate 1 cm. f, g Quantification of the number of mice with the presence of a tumour ≥2 mm in diameter (f) or the number of mice in each severity group as indicated (g) in Otulin∆hep and control mice at the age of 50–54 weeks. h Maximal tumour size in Otulin∆hep mice, grouped by degree of pathology. Each data point represents the maximal tumour size in one mouse. Red bars indicate means ± SD. i Micrographs of H&E stained liver sections from Otulin∆hep and control mice aged 50–54 weeks. (i) shows a control liver, (ii) shows HCC with abnormal macrotrabecular pattern, (iii) shows raised nuclear-cytoplasmic ratio, irregular nuclear outlines, and several mitotic figures (arrowheads), and (iv) shows a tumour with a steatohepatic appearance, with also enlarged and irregular nuclei. Micrographs are representative of four controls and 15 Otulin∆hep mice. Tu tumour. NT non-tumour. b–d Data are presented as individual data points, each representing one mouse. Red bars indicate means. Data were analysed using an unpaired, two-sided Student’s t test. n.s., non-significant. See also Fig. S4.

