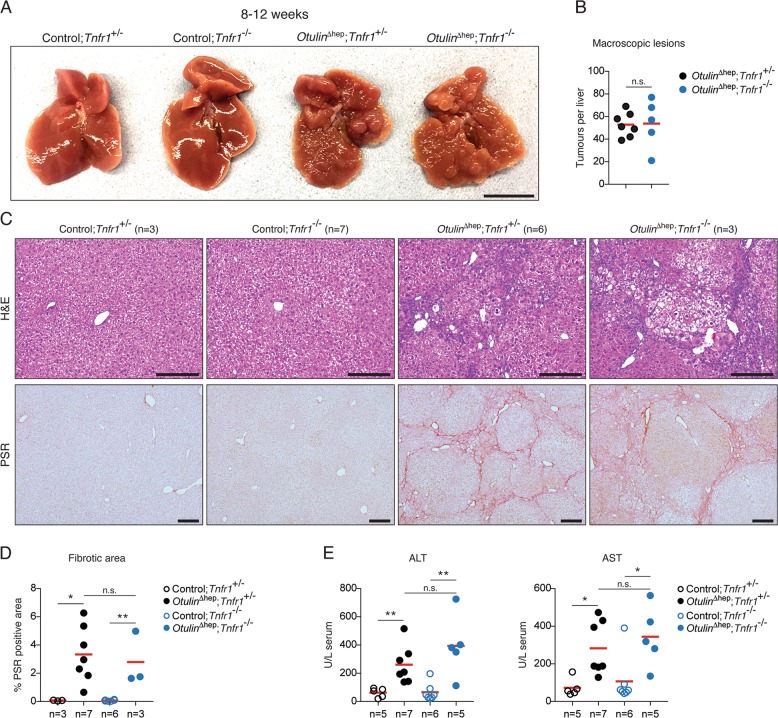
Fig. 5. Liver disease in Otulin∆hep mice is independent of TNFR1 signalling.
a Representative macroscopic appearance of livers from Otulin∆hep mice, Otulin∆hep;Tnfr1−/− mice, and their respective controls at the age of 8–12 weeks. Scale bar indicates 1 cm. b Quantification of the number of macroscopically discernible lesions (tumours, nodules, and discolourations) in Otulin∆hep (n = 7) and Otulin∆hep;Tnfr1−/− (n = 5) mice aged 8–12 weeks. c Micrographs of liver sections from Otulin∆hep mice, Otulin∆hep;Tnfr1−/− mice, and their respective controls at the age of 8–12 weeks stained with H&E or PSR as indicated. d Quantification of PSR-positive (fibrotic) area in liver sections Otulin∆hep mice, Otulin∆hep;Tnfr1−/− mice, and their respective controls at the age of 8–12 weeks. e Analysis of ALT and AST levels in serum from terminal bleeds of Otulin∆hep mice, Otulin∆hep;Tnfr1−/− mice, and their respective controls at the age of 8–12 weeks. b, d, e Data are presented as individual data points, each representing one mouse. Red bars indicate means. Data were analysed using unpaired, two-sided Student’s t tests. n.s., non-significant. See also Fig. S5.

