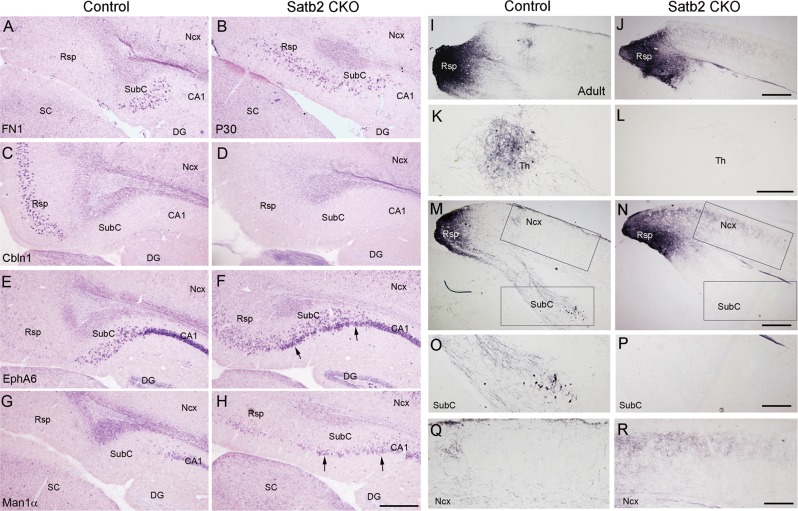
Fig. 3.
Rsp/SubC-specific gene expression is altered, and Rsp-associated efferent projection is aberrant in Satb2 CKO mice. At P30, FN1 expression is restricted to the SubC of control mice (a), but expands into the Rsp region of Satb2 CKO mice (b). Cbln1 is expressed in the Rsp of control mice (c) but absent in Satb2 CKO mice (d). e, f Intense EphA6 expression is present in CA1 pyramidal layer, and some EphA6+ cells with moderate signals are scattered in the SubC of control mice (e). In contrast, many EphA6+ cells with moderate signals are ectopically present in the Rsp region, and densely packed cells with intense signals (arrows) are ectopically located in the ventral SubC of Satb2 CKO mice (f). Man1α is selectively expressed in CA1 field of control mice (g), but many Man1α+ cells are present in the ventral SubC and the Rsp region of Satb2 CKO mice (arrows, h). i, j Injection sites of BDA in the Rsp of adult control and CKO mice. k–r Abundant BDA-labeled axon terminals are observed in ipsilateral anteroventral thalamic nuclei (k), and to less degree in ipsilateral SubC (m, o) in control mice. However, these projections are almost undetected in Satb2 CKO mice (l, n, p). Note that an increase of ipsilateral projection to neighboring cortex is observed in Satb2 CKO mice compared with control (q, r). DG dentate gyrus; Ncx neocortex; SC superior colliculus; Th thalamus. n = 3 mice for each genotype in ISH and n = 3 for each genotype in BDA tracing. Scale bars = 400 μm in a–j, m, and n, 200 μm in k, l, and o–r

