Fig. 3.
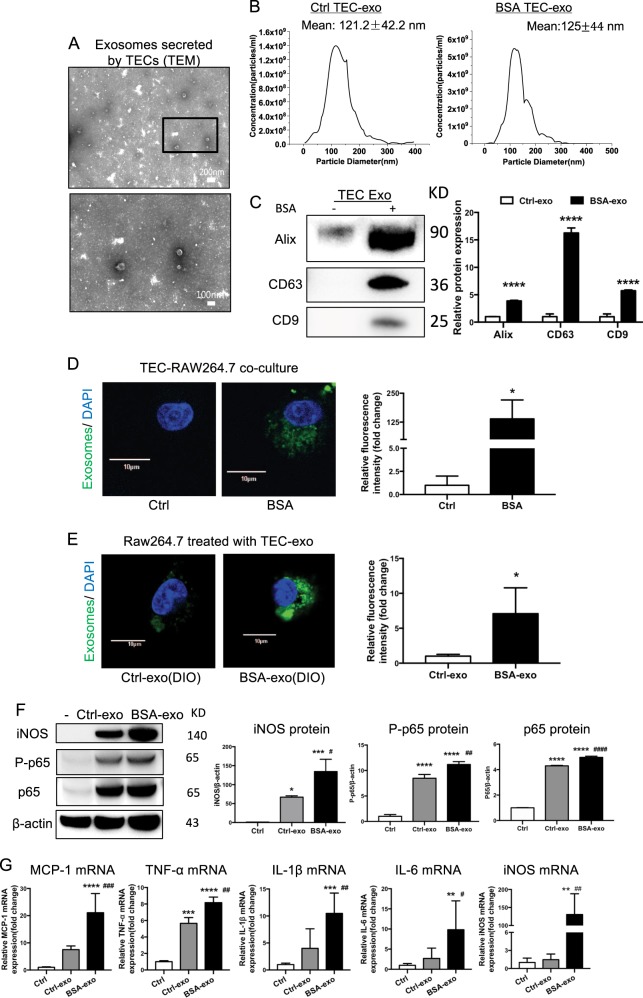
Increasing internalization of TEC-derived exosomes promoted M1 macrophage activation. a Representative electron micrograph images of exosomes isolated from TEC conditioned medium. Scale bar, 200 and 100 nm. b Shown are size distribution of exosomes isolated from TECs conditioned medium by nanoparticle analysis (NTA). c Representative western blotting and quantification of exosomal markers (including Alix, CD9 and CD63) in TEC-derived exosomes with or without BSA (****p < 0.0001 vs exosomes from control TECs). d DiO-labeled TECs were co- cultured with recipient Raw264.7 macrophages using transwell system in the absence/presence of BSA for 24 h Relative fluorescence intensity was quantified to identify the uptake of exosomes. (*p = 0.012 vs Ctrl). Scale bar, 10 μm. e Exosomes were purified from DiO-labeled TECs and were then applied to recipient Raw264.7 macrophages. Relative fluorescence intensity was calculated (*p = 0.0461 vs Ctrl-exosomes). f Representative western blotting and quantification of iNOS, P-p65, p65 in recipient Raw264.7 macrophages treated with TEC-derived exosomes in the absence or presence of BSA. g Inflammatory cytokine mRNA (MCP-1, IL1β, TNF-α, IL6) and iNOS mRNA expression in recipient RAW264.7 macrophages were detected by real-time PCR. **p < 0.01; ***p < 0.001; ****p < 0.0001 compared with cells without exosomes; #p < 0.05; ##p < 0.01; ###p < 0.001 compared with cells with Ctrl-exo. Ctrl exo exosomes from TECs without BSA, p values were calculated using one-way ANOVA test. Bornferroni-corrected α threshold was used for statistical significance of multiple comparison. BSA-exo exosomes from TECs with BSA treatment. Data presented as mean ± S.E.M. of three independent experiments

