Fig. 4.
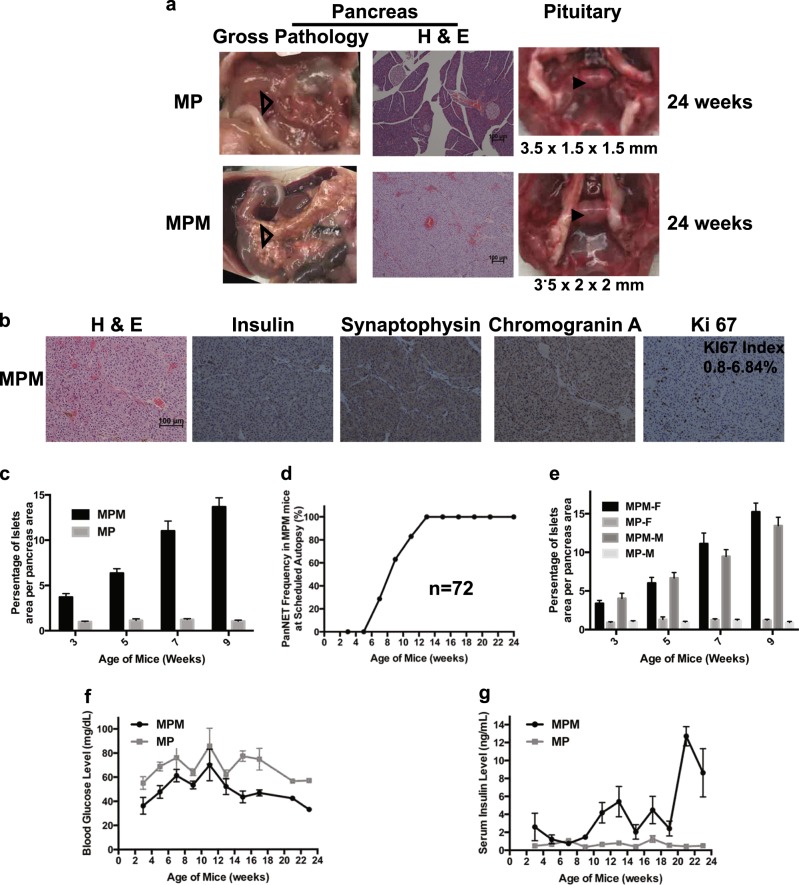
Another well-differentiated pancreatic neuroendocrine tumor (PanNET) mouse model—MPM. a Gross pathology of pancreas and pituitary, and hematoxylin and eosin (H & E) staining of pancreas at 24 weeks in MP and MPM mice. Pancreas is shown with open triangle inside the mouse abdomen and pituitary is shown with arrowhead inside the mouse brain skull. b MPM tumors were G1/G2 PanNETs—H & E and immunohistochemical staining of insulin, synaptophysin, chromogranin A, and Ki 67 in MPM mice. Ki 67 index (n = 16) is shown. c Quantitative measurements of the ratio of the islet area per pancreas area in MP and MPM mice as mice aged (n ≥ 6 of each time point and each genotype). d Tumor frequency in MPM mice (n = 72; examined mice at weeks of 3 (n = 7), 5 (n = 7), 7 (n = 7), 9 (n = 8), 11 (n = 6), 13 (n = 10), 15 (n = 4), 17 (n = 12), 19 (n = 3), 21 (n = 5), and 23 (n = 3). e Quantitative measurements of the ratio of the islet area per pancreas area in female and male MP and MPM mice as mice aged (n ≥ 3 of each time point, each genotype, and sex). f Blood glucose levels in MP and MPM mice as mice aged (n = 65 for MPM (n = 7, 7, 7, 8, 4, 10, 4, 12, 0, 5, 1 at 3, 5, 7, 9, 11, 13, 15, 17, 19, 21 and 23 weeks, respectively) and n = 64 for MP (n = 8, 8, 7, 7, 4, 12, 7, 7, 0, 3, 1 at 3, 5, 7, 9, 11, 13, 15, 17, 19, 21 and 23 weeks, respectively)) and g serum insulin levels in MP and MPM mice as mice aged (n = 68 for MPM (n = 6, 7, 7, 8, 5, 9, 4, 12, 3, 5, 2 at 3, 5, 7, 9, 11, 13, 15, 17, 19, 21 and 23 weeks, respectively) and n = 65 for MP (n = 8, 9, 8, 6, 5, 12, 7, 7, 1, 2, 0 at 3, 5, 7, 9, 11, 13, 15, 17, 19, 21 and 23 weeks, respectively)) MPM Men1flox/flox Ptenflox/flox MIP-Cre, MP Men1flox/flox Ptenflox/flox, MM Men1flox/flox MIP-Cre, PM Ptenflox/flox MIP-Cre

