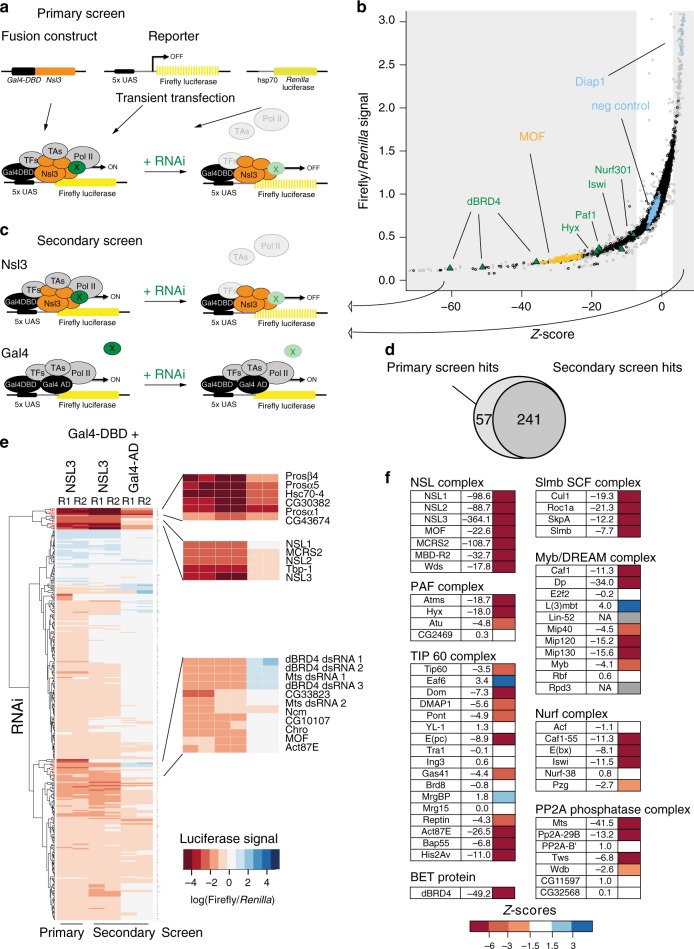
Fig. 1. RNAi screen identifies functional NSL complex interactome.
a Scheme of primary genome-wide screen. Plasmids containing a fusion construct, nsl3 gene fused to Gal4 DNA-binding domain (Gal4-DBD), a firefly luciferase reporter containing Gal4 DNA-binding upstream activating sequence elements (5xUAS) and a constitutively active hsp70 Renilla luciferase reporter were co-transfected into S2 cells. Effect of RNAi of a candidate (X) on reporter signal is assayed. Renilla signal serves a control for transfection efficiency. b Data distribution of primary RNAi screen. Scatterplot of Z-scores and luciferase signal (average of two replicates) are plotted for each knockdown (within the Z-score range of −70 to +6). Data points from grey shaded areas were used for secondary screen. Grey datapoints: candidates excluded due to strong effect on Renilla signal (see Methods for more details on filtering and analysis of RNAi screen), orange datapoints: positive control knockdowns, blue datapoints: negative control knockdowns (GST, GFP and Diap1), green triangles: other candidates (dBRD4, Nurf complex and PAF complex). c Scheme of secondary screen reporter assay. Upper part as in a, lower part: Gal4-DBD fused to Gal4 activation domain (Gal4-AD) represents the canonical full length Gal4. Full length Gal4 it is used as control, to discriminate NSL unspecific transcription factors. d Venn diagram depicting overlap of candidates that scored in the primary and secondary Nsl3-Gal4-DBD screens. The same thresholds for firefly luciferase signal relative to Renilla luciferase signal were applied for both primary and secondary screens. e Heatmap of log-scaled fold changes of normalized luciferase signal in the primary and secondary RNAi screens. Results for the 367 knockdowns performed in the secondary assays are plotted. The order of genes was generated by unsupervised hierarchical clustering. f Z-scores of genome-wide RNAi screen for several complexes and protein categories are listed. If a gene was targeted by multiple dsRNAs, an average of the respective Z-scores is given.

