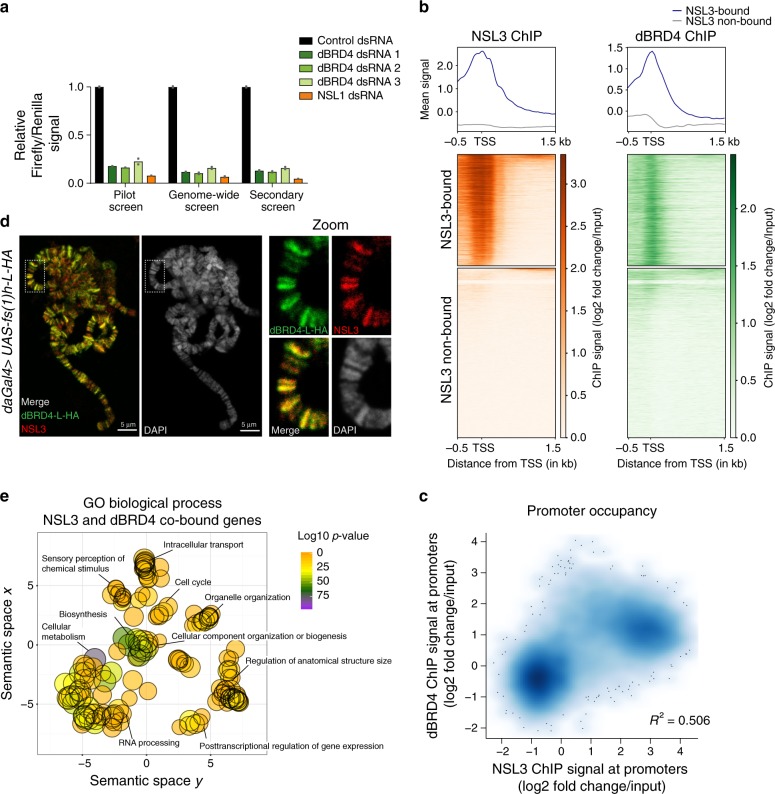
Fig. 2. The NSL complex and dBRD4 colocalize on endogenous promoters.
a Barplot of mean firefly signal normalized to Renilla signal and control RNAi (GST) of each knockdown and screen (two replicates). Source data are provided as a Source Data file. b Heatmaps and summary plots of NSL313 and dBRD425 ChIP profiles. Log2 fold changes over input are plotted for all genes. Genes of both heatmaps are clustered and sorted based on NSL3 ChIP signal. p-value < 2.2e-16 for one-sided Fisher’s Exact Test on overrepresentation of dBRD4 binding on NSL3-bound promoters. c Scatterplot of NSL313 and dBRD425 ChIP signals on gene promoters (TSS ± 200bp). Log2 fold changes over input are plotted for all gene promoters. R2 was calculated with linear regression model. d Polytene chromosome immunostaining of daGal4 > UAS-fs(1)h-L-HA third instar larvae. NSL3 staining in red, HA staining in green: tagged long isoform of dBRD4 (dBRD4-L-HA). Scale bar: 5 µm. This experiment was repeated independently two more times showing similar results. e Gene Ontology (GO) Enrichment analysis of Biological Processes of genes promoter-bound by both dBRD4 and NSL3. Promoter-bound genes were defined by MACS peak calling on dBRD425 and NSL313 ChIP-seq datasets considering TSS ± 200 bp as promoter region. Enriched GO terms were visualized with REVIGO.

