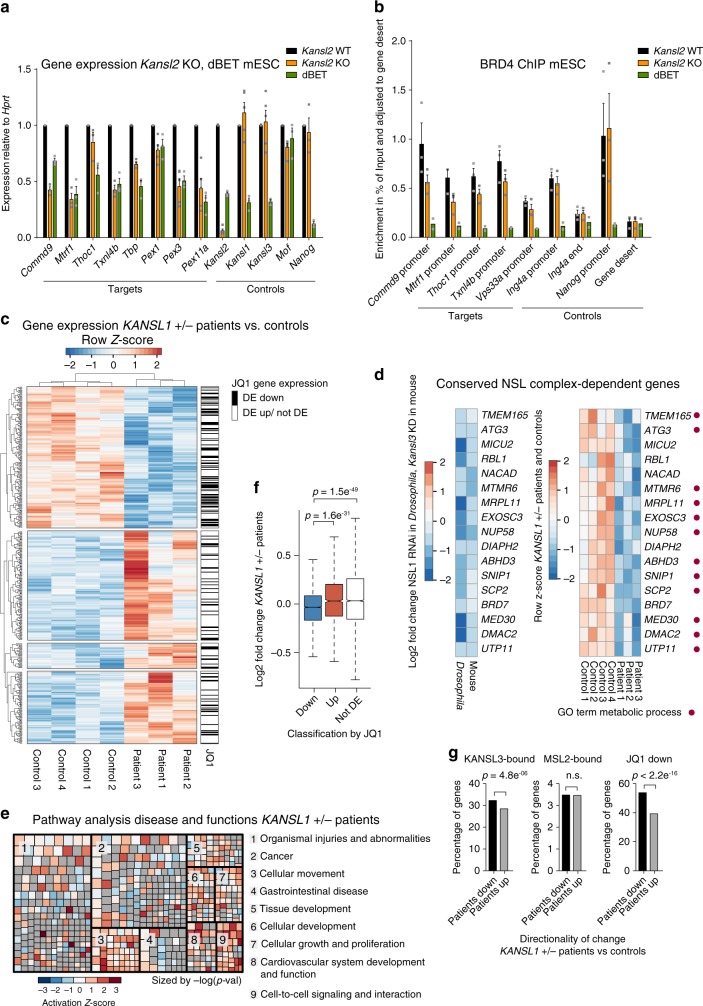
Fig. 6. The NSL complex/BRD4 axis is conserved in mice and humans.
a RT-qPCR analyses of Kansl2fl/fl, Cre-ERT2 mESCs with (Kansl2 KO) and without (Kansl2 WT) tamoxifen treatment (500 nM, 3 days), and dBET6-treated (100 nM, 4 h) Kansl2 WT cells, see also Supplementary Fig. 6. Expression is normalized to HPRT and relative to Kansl2 WT. b ChIP-qPCR of BRD4 in Kansl2 KO, Kansl2 WT and dBET6-treated mESCs. ChIP enrichments are relative to gene desert signal. Primers target KANSL2-responsive (target) and KANSL2-non-responsive (control) genes. a, b Bars represent mean ± SEM (n = 3, for dBET ChIP n = 2 biological replicates). Source data are provided as a Source Data file. c Heatmap of row-scaled normalized RNA-seq counts from fibroblast cell lines of three Koolen-de Vries/KANSL1 haploinsufficient (KANSL1+/−) patients and four controls (for genes FDR < 0.2). Order was generated by unsupervised hierarchical clustering. Genes significantly downregulated (DE down) (FDR < 0.05) upon JQ1 treatment in MOLT4 cells33 are indicated in black, upregulated (DE up) or not differentially expressed (not DE) in white. d Left, log2 fold changes of conserved, NSL complex-dependent genes for NSL1 RNAi in Drosophila (FDR < 0.05), and Kansl3 knockdown in mESCs (FDR < 0.05,11). Right, row-scaled normalized RNA-seq counts of KANSL1+/− patients and controls (FDR < 0.4). Red dot indicates association with GO term Metabolic Process. e Ingenuity Pathway Analysis showing most affected Disease and Functions groups of DE genes (FDR < 0.1) obtained from DESeq2 analysis of KANSL1+/− patient fibroblast RNA-seq. Grey Z-score indicates NA. Boxes are sized by negative log p-value. f Boxplots of log2 fold change of KANSL1+/− patient fibroblasts versus controls for classes of genes, based on differential expression upon JQ1 treatment33: DE down (n = 5581), DE up (n = 1482), not DE (n = 3716). Boxplots show median (centre), interquartile-range (box) and minima/maxima (whiskers).Two-sided Wilcoxon-rank-sum test was applied. g Left and middle: percentage of genes whose mouse orthologues are promoter-bound by KANSL3 (n = 3665)(left) or MSL2 (n = 846) (middle) in mESC and downregulated (black bars) or upregulated (grey bars) in KANSL1+/− patients. Right: percentage of genes significantly downregulated (FDR < 0.05) upon JQ1 treatment in MOLT4 cells (n = 5581)33 and down-or upregulated in KANSL1+/− patients. Up/down classification of patient gene expression indicates directionality. Overrepresentation of downregulated genes was tested with one-sided Fisher’s exact test.

