Fig. 1.
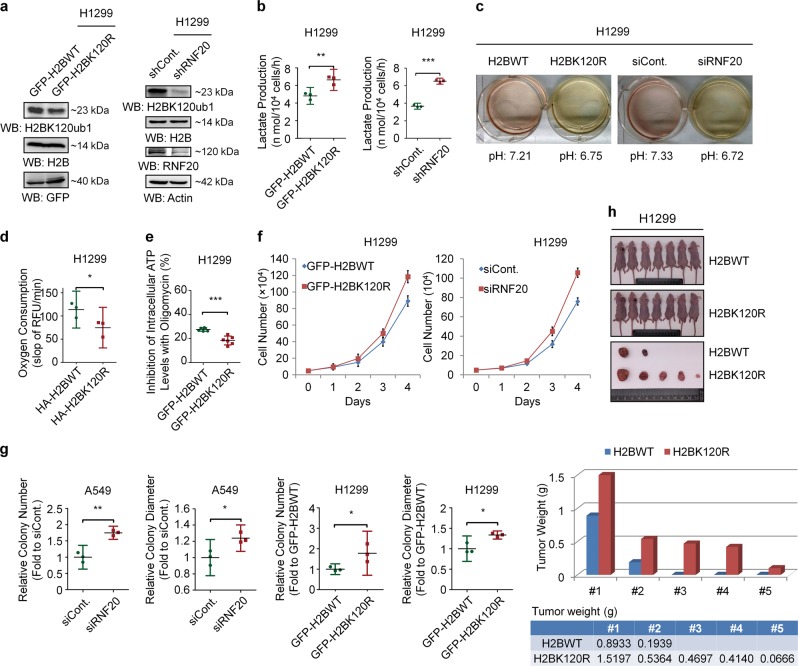
Loss of H2Bub1 promotes the Warburg effect and tumor cell growth. a Left: H1299 cells were transfected with GFP-tagged wild-type H2B (GFP-H2BWT) or GFP-tagged K120R-mutated H2B (GFP-H2BK120R) for 48 h. Cells were then lysed and subjected to Western blot analysis with antibodies as indicated. Right: H1299 cells were transfected with control shRNA (shCont.) or RNF20-specific shRNA (shRNF20) for 48 h. Cells extracts were then prepared and subjected to Western blot analysis with antibodies as indicated. b H1299 cells transfected with GFP-tagged wild-type H2B plasmid (GFP-H2BWT) or GFP-tagged K120R-mutated H2B plasmid (GFP-H2BK120R) and control shRNA (shCont.) or RNF20-specific shRNA (shRNF20) were prepared. The cells (2 × 10⁴) were then seeded into a 96-well plate, and the culture medium from each well was harvested to assess the levels of lactate production. c H1299 cells were transfected with HA-tagged wild-type H2B (H2BWT) or HA-tagged K120R-mutated H2B (H2BK120R) and control shRNA (shCont.) or RNF20-specific shRNA (shRNF20) for 72 h. The cells were then photographed, and the pH of the culture medium was determined. d H1299 cells (1 × 10⁵) transfected with HA-tagged wild-type H2B plasmid (HA-H2BWT) or K120R-mutated H2B plasmid (HA-H2BK120R) were seeded into 96-well plates. After 12 h, oxygen consumption levels were assessed by the time-resolved fluorescence (TR-F) measurement. Values are expressed as the slope of RFU/min. e H1299 cells transfected with GFP-tagged wild-type H2B (GFP-H2BWT) or GFP-tagged K120R-mutated H2B (GFP-H2BK120R) were prepared. The cells (1 × 10⁴) were then seeded into a 96-well plate in the presence or absence of 100 ng/ml oligomycin for 1 h, and the luminescence signals of each well were assessed to indicate the inhibition of intracellular ATP by oligomycin. Note that oligomycin, a specific inhibitor of mitochondrial ATP synthase, decreases oxidative phosphorylation. f Equal amounts (5 × 10⁴) of H1299 cells transfected with GFP-tagged wild-type H2B (GFP-H2BWT), K120R-mutated H2B (GFP-H2BK120R), control siRNA (siCont.), or RNF20-specific siRNA (siRNF20) were plated and counted continuously for 4 days. g Soft agar anchorage-independent growth assay was performed upon H2Bub1 depletion in both A549 and H1299 cells (detailedly described in figure legends of Fig. S1k), and the relative number and diameter of the colonies were quantified. h In vivo tumor growth analysis was performed with H1299 cells stably transfected with GFP-tagged wild-type H2B (H2BWT) or GFP-tagged K120R-mutated H2B (H2BK120R) in nude mice. n = 7 mice in each group. The tumor weights are shown blow (one column only represents the weight of one tumor). The results of f are shown as mean ± S.D., and the others are shown as the mean with 95% CI. *p < 0.05; **p < 0.01; ***p < 0.001

