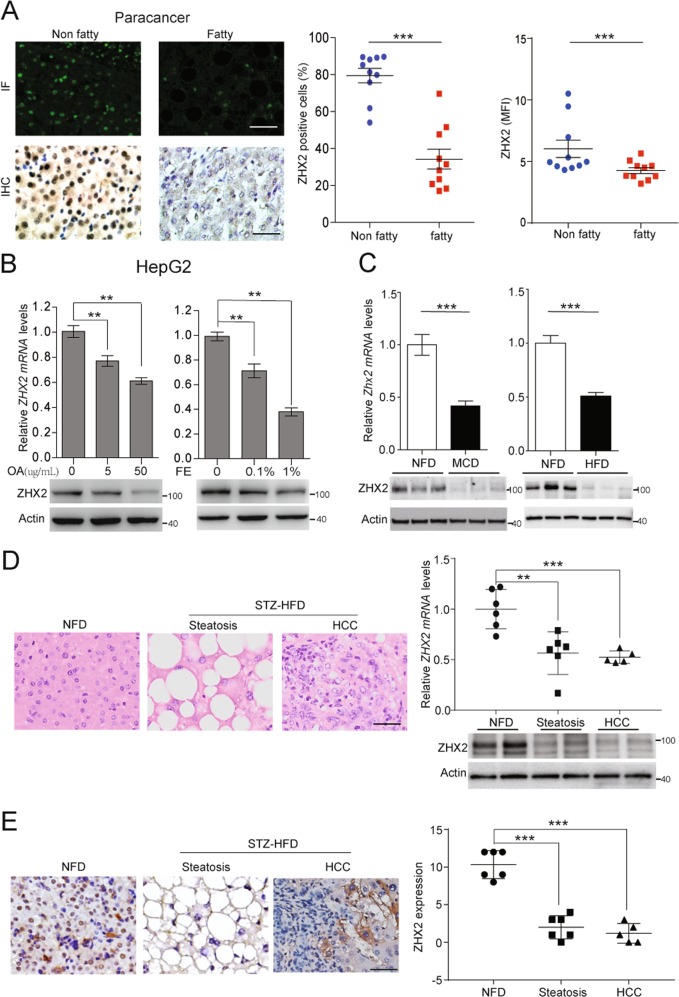
Fig. 1.
ZHX2 expression was decreased in lipids-treated HepG2 cells and fatty livers. a Expression of ZHX2 in human non-fatty liver specimens and fatty liver specimens were determined by IHC and IF. The representative images were shown on the left panel. The right panel showed the percentages of ZHX2 positive cells and florescence intensity of ZHX2 in the specimens. n = 10; ***p < 0.001. b ZHX2 expression was detected in oleic acid (OA)- or fat emulsion (FE)-treated HepG2 cells by RT-PCR and Western blot. The quantification data were shown on the upper panel. n ≥ 6; **p < 0.01. Western blot results were shown on the lower panel. c ZHX2 expression was determined in fatty livers from MCD diet- or HFD-induced mice by RT-PCR and Western blot. The quantification of ZHX2 mRNA levels was shown on the upper panels. n ≥ 4; ***p < 0.001. ZHX2 protein levels were shown on the lower panel. d STZ–HFD was used to induce NAFL–HCC murine model. Steatosis and HCC as two stages in the progression of NAFLD to HCC were determined by H&E staining and shown on the left panel. The right panel showed the ZHX2 expression at mRNA and protein levels in liver tissues from the mice fed with non-fatty diet (NFD) and pathological tissues induced by STZ–HFD. **p < 0.01, ***p < 0.001. e ZHX2 expression in mice liver tissues was confirmed by IHC staining and showed on left panel. Right panel showed the quantification of ZHX2 IHC staining. ***p < 0.001. Data presented are mean ± SEM, n = 6

