Fig. 2.
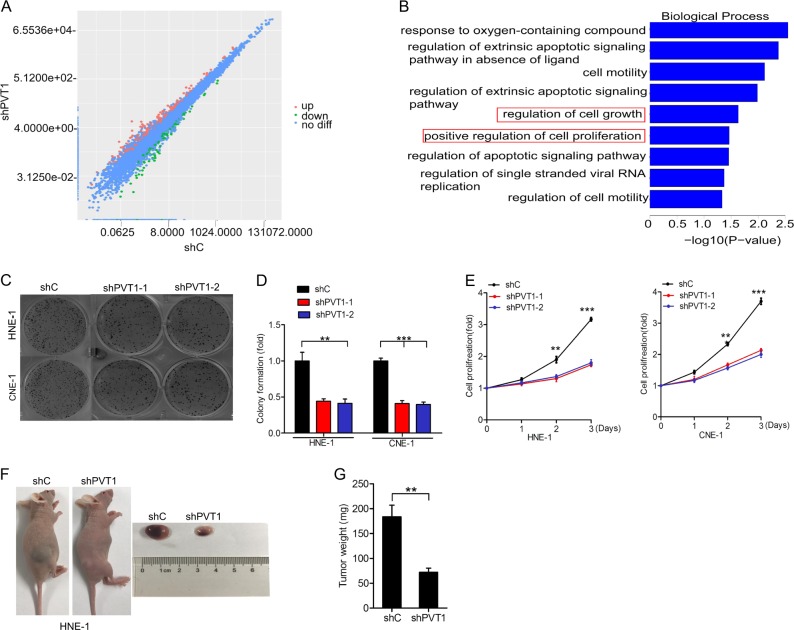
Knockdown of PVT1 disrupts NPC cell proliferation and tumor growth. a Scatter plot of 16764 gene expression in HNE-1 cells transfected with PVT1 shRNA (y-axis) compared with the control group (x-axis). Green dots, set of genes exhibiting significant downregulation upon PVT1 knockdown; red dots, set of genes exhibiting significant upregulation upon PVT1 knockdown; black dots, the genes without significant change. b The biological process signaling pathways response upon PVT1 knockdown by Gene GO analyses. c Effects of PVT1 knockdown on NPC cell colony formation. d Quantification of colony formation in c. e Effects of PVT1 knockdown on NPC cell proliferation. f Representative images of PVT1 knockdown-inhibited HNE-1 subcutaneous tumor generation. Tumors were harvested at 3–4 weeks after implantation. Data were from two independent experiments with five mice per group with similar results. g Quantification of tumor weight in f. Error bars ± SD. **P < 0.01. ***P < 0.001. Data are representative from three independent experiments

