Fig. 1.
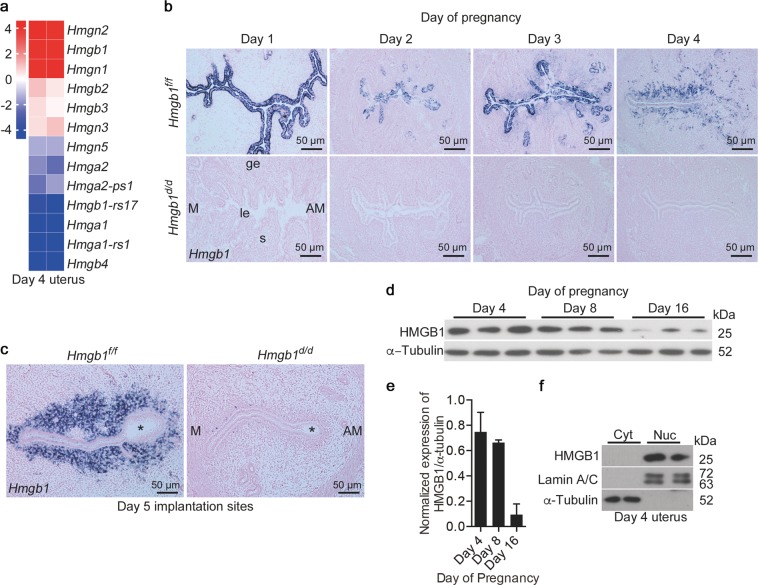
Expression of HMGB1 in early pregnant uteri. a Heatmap shows relative expression levels of Hmg family members in day 4 pregnant uteri. Data are expressed as reads log2 per kilobase per million (RPKM) for RNA-seq analysis, n = 2. b, c In situ hybridization of Hmgb1 expression in Hmgb1f/f and Hmgb1d/d uteri from days 1–5 of pregnancy. Asterisks indicate the location of blastocysts. le luminal epithelium, s stroma, ge glandular epithelium, M mesometrial pole, AM antimesometrial pole. Scale bar: 50 µm. d, e Western blotting of HMGB1 in uterine tissues on days 4, 8, and 16 of pregnancy (d) and quantification of the bands (e). α-Tubulin was used as a loading control. Data are presented as mean ± SEM. f HMGB1 levels in the cytosolic and nuclear fractions from day 4 pregnant uteri. Lamin A/C and α-Tubulin are markers for nuclei and cytosol, respectively. Cyt cytosol, Nuc nuclei. In each group, at least three independent samples from different mice were examined. All uteri were collected at 9–10 a.m. on the indicated day of pregnancy. See also Fig. S1

