Fig. 2.
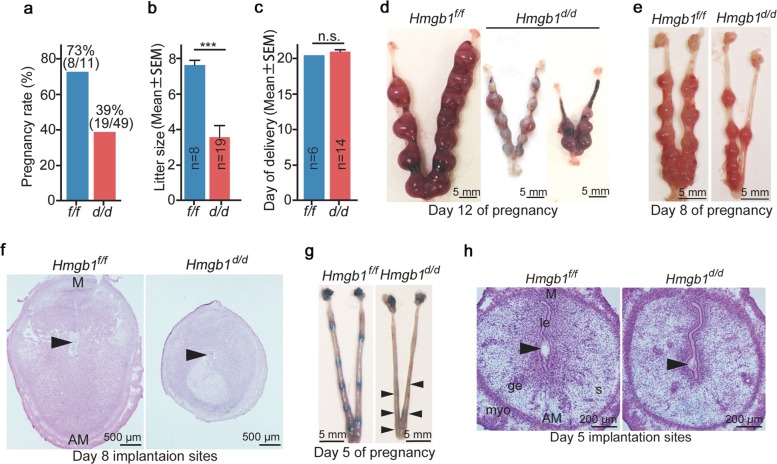
Deletion of Hmgb1 in uteri compromises embryo implantation and pregnancy outcome. a Pregnancy rate in Hmgb1f/f and Hmgb1d/d females. The number within brackets indicate females with pups over total number of plug-positive females. b Average number of litter sizes in Hmgb1f/f and Hmgb1d/d females. Hmgb1f/f (n = 8); Hmgb1d/d (n = 19). Data are presented as mean ± SEM, ***P < 0.001 (two-tailed Student’s t test). c Average day of delivery. n = 6 for Hmgb1f/f and n = 14 for Hmgb1d/d. Data are presented as mean ± SEM, n.s. not significant (two-tailed Student’s t test). d Representative images of day 12 pregnant uteri from Hmgb1f/f and Hmgb1d/d females. Scale bar: 5 mm. e Representative images of day 8 pregnant uteri from Hmgb1f/f and Hmgb1d/d females. Scale bar: 5 mm. f Histology of day 8 implantation sites from Hmgb1f/f and Hmgb1d/d females. Arrowheads indicate the location of embryos. M mesometrial pole, AM antimesometrial pole. Scale bar: 500 μm. g Representative images of day 5 implantation sites (blue bands) in Hmgb1f/f and Hmgb1d/d females. Arrowheads indicate blue bands. Scale bar: 5 mm. h Histology of day 5 implantation sites in Hmgb1f/f and Hmgb1d/d females. Arrowheads indicate the location of blastocysts. le luminal epithelium, s stroma, ge glandular epithelium, myo myometrium, M mesometrial pole, AM antimesometrial pole. Scale bar: 200 μm. Each image is a representative from at least three independent experiments. All uteri were collected at 9–10 a.m. on the indicated day of pregnancy

