Fig. 1.
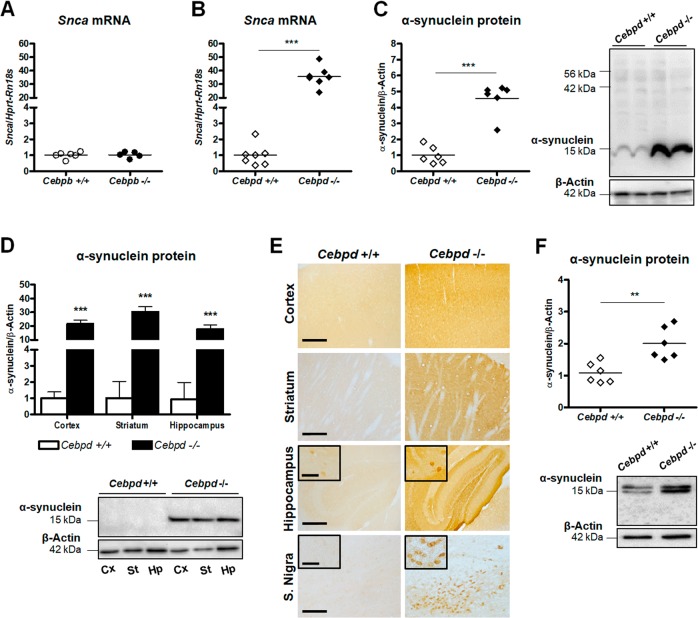
Expression of α-synuclein in Cebpb−/− and Cebpd−/− mice. a No significant change in cerebral cortex Snca mRNA levels (p = 0.8402) is observed between Cebpb+/+ and Cebpb−/− mice. b Snca mRNA expression increases 35.7-fold (p < 0.0001) in the cerebral cortex of Cebpd−/− mice when compared with Cebpd+/+ mice. c The 15 kDa α-synuclein protein increases 4.5-fold (p < 0.0001) in the cerebral cortex of Cebpd−/− mice when compared with Cebpd+/+ mice. d A 15 kDa band of α-synuclein protein is increased significantly in Cebpd−/− mice in different brain areas: cerebral cortex (p = 0.0002), striatum (p = 0.0002) and hippocampus (p = 0.0009). e Increased α-synuclein immunostaining is observed in several brain areas (cortex, striatum and hippocampus) of Cebpd−/− mice when compared with Cebpd+/+mice. Many substantia nigra (S. Nigra) cells are intensely immunostained in Cebpd−/− mice. Magnification bar 300 µm, 100 µm in insets. f A significant increase in the 15 kDa band of α-synuclein protein is observed in primary cortical neuron cultures prepared from Cebpd−/− mice (p = 0.0036). Snca mRNA is evaluated in the mouse cerebral cortex by qRT-PCR using Rn18s as housekeeping gene. α-Synuclein protein is assessed in mouse brain areas and neuronal cultures by western blot using β-actin as the normalizing protein. Mice used in the in vivo experiments were of 2 months of age. In d white and black bars correspond to Cebpd+/+ and Cebpd−/−, respectively, and bars show mean ± SD of n = 3 animals. **p < 0.01 and ***p < 0.001, using Student’s t-test

