Figure 1.
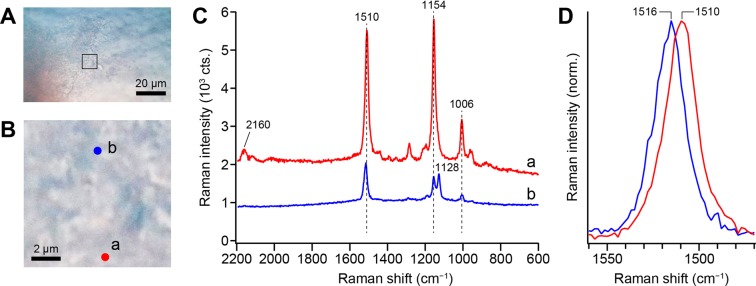
Optical microscopy and Raman microspectroscopy measurements of a pink biofilm collected from the drain of a bathroom. (A) Optical micrograph of the pink biofilm. Scale bar, 20 μm. (B) Enlarged view of the region in which we performed a Raman imaging experiment. This region is indicated by a square in A. Scale bar, 2 μm. (C) 532-nm excited Raman spectra (raw data) measured at points a (red line) and b (blue line) shown in B. The spectra were taken with 1 mW laser power and a 0.5 s exposure time. Neither smoothing nor noise reduction was performed. (D) Comparison of the C=C stretching band in the Raman spectra measured at points a (red line) and b (blue line). The bands are normalized to the peak height.

