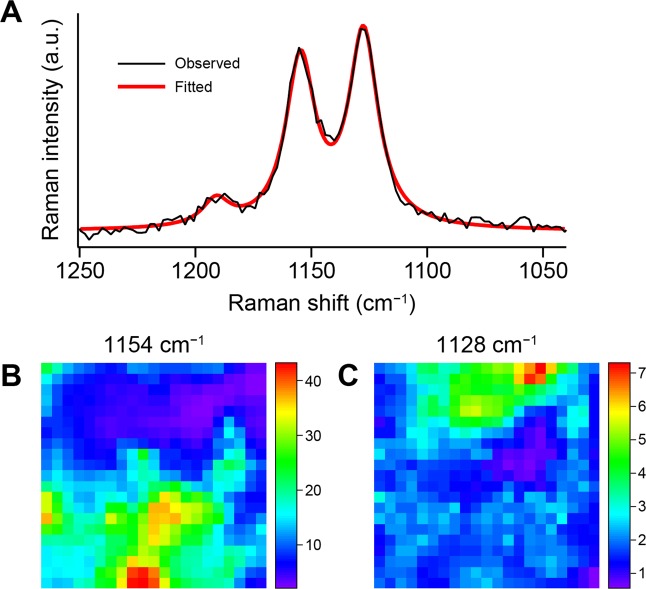
Figure 2.
Construction and comparison of the Raman images at 1128 and 1154 cm−1. (A) Baseline-corrected Raman spectrum at point b in Fig. 1B (black line) and best fit to a sum of three Lorentzian functions (thick red line). The baseline correction was done using polynomial functions (see Methods for details). (B,C) Distribution maps of the area intensities of the Lorentzian functions accounting for the 1154 cm−1 band (B) and the 1128 cm−1 band (C). The scanned area corresponds to Fig. 1B. The Raman images are displayed in rainbow pesudocolor with red representing the highest intensity and purple the lowest.

