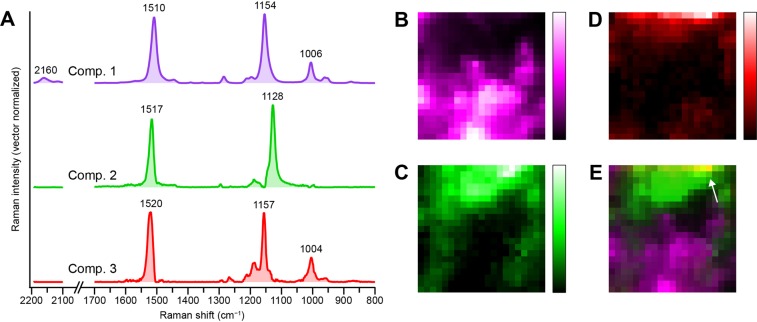
Figure 3.
MCR–ALS Analysis of the Raman hyperspectral imaging data of the pink biofilm assuming three components (k = 3). (A) Intrinsic Raman spectra of the three components (denoted 1–3). Each spectrum has been normalized so that the sum of intensities at all Raman shifts is equal to unity. The spectra are vertically offset for clarity of display. (B–D) Raman images of components 1 (B), 2 (C), and 3 (D). The Raman images are shown in pseudocolor. (E) Merged image of B–D, indicating mutually exclusive distributions of components 1 (magenta) and 2 (green). Colocalization of components 2 (green) and 3 (red) is manifested as a yellow region (indicated by an arrow).

