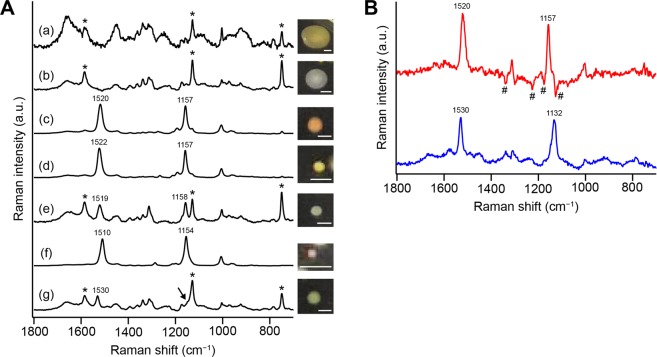
Figure 4.
Raman spectra of microbial cells isolated from the pink biofilm sample. (A) Averaged Raman spectra (a–g) of 10 different single cells taken from the seven colonies isolated from the same pink biofilm as in Figs. 1–3. Also shown are pictures of the colonies on agar plates (scale bar, 0.5 mm). The Raman spectra were measured in R2A medium. Asterisks denote resonance Raman bands of cytochromes. The arrow highlights a shoulder adjacent to the intense cytochrome band at ~1128 cm−1. (B) Difference spectra between b and e (e minus b; red line) and between b and g (g minus b; blue line). In doing subtraction, an appropriate coefficient was multiplied to spectrum b so that the major Raman bands of proteins including cytochromes were mostly cancelled. Yet, subtraction artifacts due to inadequate cancelation of the protein Raman bands (marked with #) are seen in the difference spectrum between b and e (red line).

