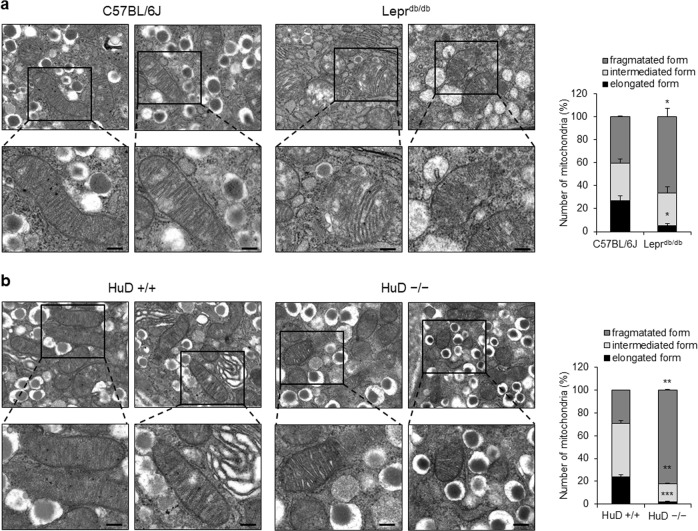
Fig. 1.
Mitochondrial morphology in the pancreas of diabetic mice. Mitochondrial morphology was analyzed in the pancreas of normal C57BL/6J and diabetic (Leprdb/db) mice (a) and the pancreas of HuD knockout mice (b) using a transmission electron microscope (TEM). Bar, 0.2 μm. Fifty mitochondria from each group were counted according to their relative length. Images are representative and the values indicate the mean ± SEM obtained from three independent analyses. *p < 0.05; **p < 0.01; ***p < 0.001

