Fig. 2.
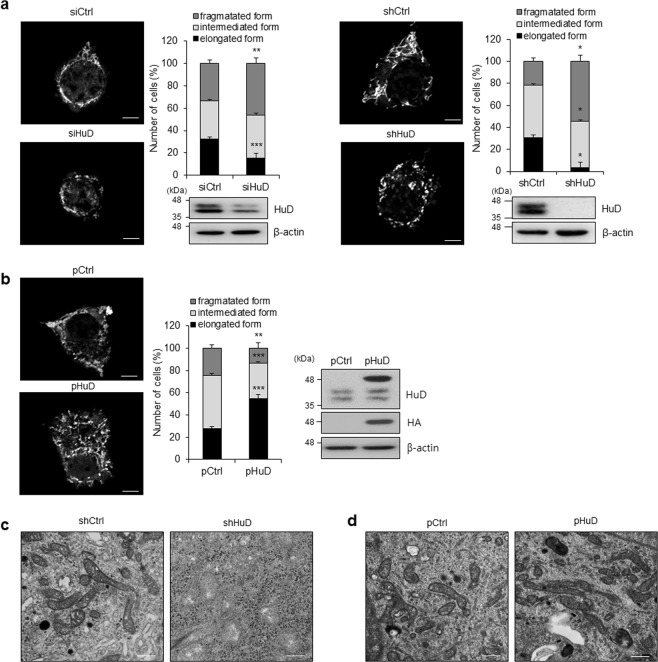
Regulation of mitochondrial morphology by HuD. a, b HuD knockdowned βTC6 cells using either siRNA (left) or small hairpin RNA (right) (a) and HuD overexpressing βTC6 cells using a retrovirus carrying HA-HuD (pHuD) (b) were incubated with MitoTracker® and the mitochondrial morphology was analyzed using a fluorescence microscope. Bar, 4 μm. The number of mitochondria was assessed by counting at least 300 cells from three independent experiments. Western blot analysis shows relative level of HuD and β-actin. c, d Mitochondrial morphology of βTC6-shHuD cells and βTC6 cells after HuD overexpression (pHuD) was analyzed with a TEM. Bar, 0.5 μm. Images are representative and the values indicate the mean ± SEM from three independent analyses. *p < 0.05; **p < 0.01; ***p < 0.001

