Fig. 6.
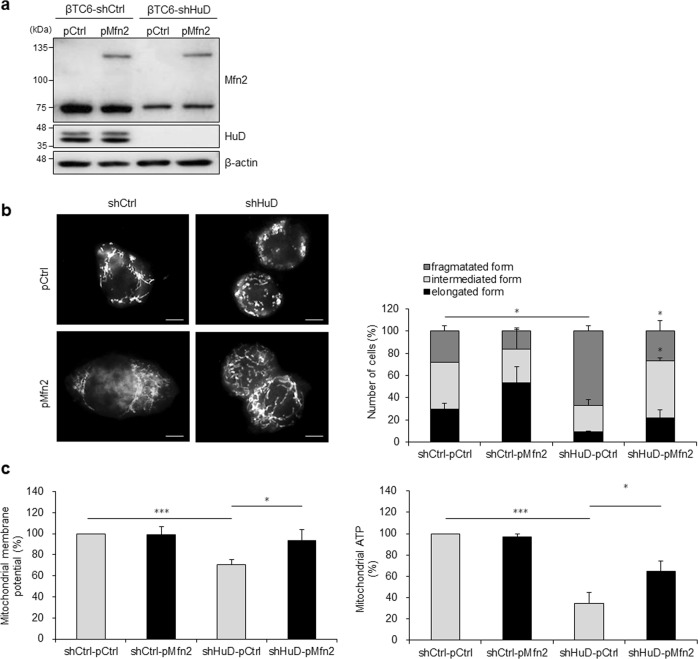
Regulation of mitochondrial dynamics along the HuD/Mfn2 axis. βTC6-shCtrl and βTC6-shHuD cells were transfected with pMfn2 and pCtrl. a Mfn2 and HuD protein levels were analyzed by western blot analysis. b After transfection with pMfn2, cells were incubated with MitoTracker® and mitochondrial morphology was analyzed using a fluorescence microscope. Bar, 5 μm. c After transfection with pMfn2, mitochondrial membrane potential and ATP level were determined by JC-1 staining and mitochondrial ToxGlo™ assay. Data represent the mean ± SEM derived from three independent experiments. *p < 0.05; ***p < 0.001

