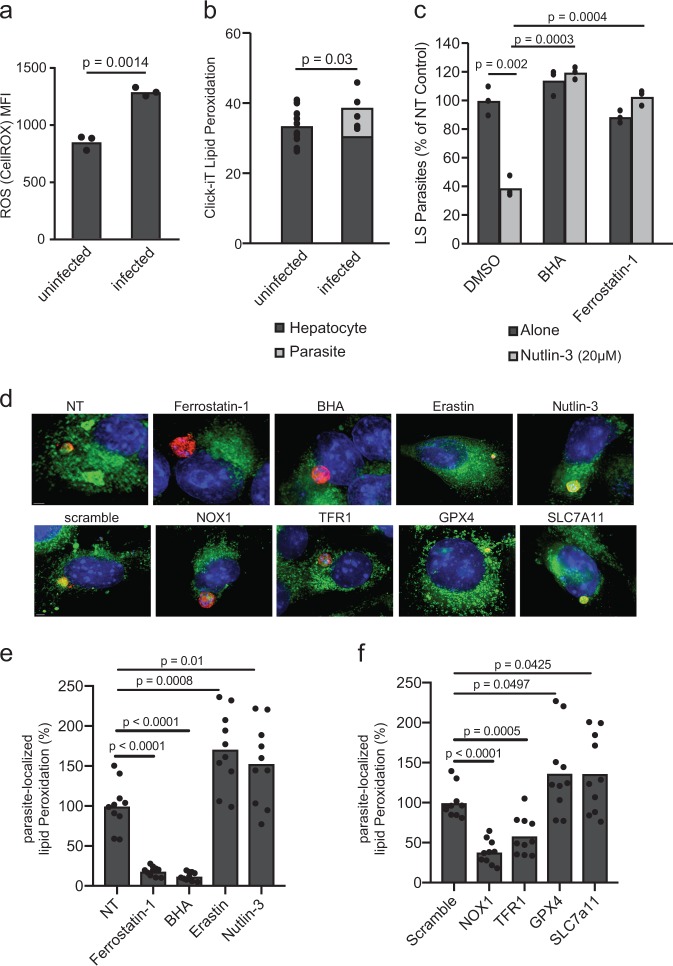
Fig. 3.
Reactive oxygen species (ROS) and lipid peroxidation are key mediators of SLC7a11 pathway control of LS infection. a Hepa1-6 cells were infected with 1.5 × 10⁵ P. yoelii sporozoites and then evaluated for ROS with a CellROX dye 24 h after infection via flow cytometry. Mean fluorescent intensity (MFI) of signal obtained is presented. P-value was obtained using a Student’s t-test. b Hepa1-6 cells were infected with 1.5 × 10⁵ P. yoelii sporozoites and then evaluated for lipid peroxidation with Click-iT Lipid dye 24 h post-infection by fluorescence microscopy. Data are shown as fluorescence intensity normalized to area in infected and uninfected cells. Fluorescent signal was identified as localizing to the hepatocyte or to the parasite. Each dot represents a single cell. c 1.5 × 10⁵ Hepa1-6 cells were infected with 5 × 10⁴ P. yoelii sporozoites. 90 min post-infection, cells treated with a DMSO control, 20 µM Nutlin-3, 5 µM BHA, or 300 nM ferrostatin-1 as indicated. Parasites were visualized by Py HSP70 staining 24 h post-infection and quantified by microscopy. In all panels, points represent individual analytical replicates. d Hepa1-6 cells, in the context of knockdown or drug treatment as indicated, were infected with 1.5 × 10⁵ P. yoelii sporozoites and then evaluated for lipid peroxidation with Click-iT Lipid dye 24 h post-infection by fluorescence microscopy. Click-iT Lipid dye and drug treatments were added 90 min post-infection. Drug treatments include Erastin (5 µM), Ferrostatin-1 (10 µM), BHA (5 µM), and Nutlin-3 (20 µM). Representative merged images of hepatocytes 24 h after infection with P. yoelii are shown. DAPI is shown in blue, Py HSP70 in red, and lipid peroxides in green. The scale bar is 2 µm. e Quantification of parasite-localized lipid peroxidation, normalized to area, 24 h post-infection, in the context of drug treatment. Data were normalized to the NT mean. Each point represents a single infected cell. f Quantification of parasite-localized lipid peroxidation, normalized to area, 24 h post-infection, in the context of each knockdown. Data were normalized to the scramble. Each point represents a single infected cell. P-values were obtained using a Student’s t-test

