Fig. 1.
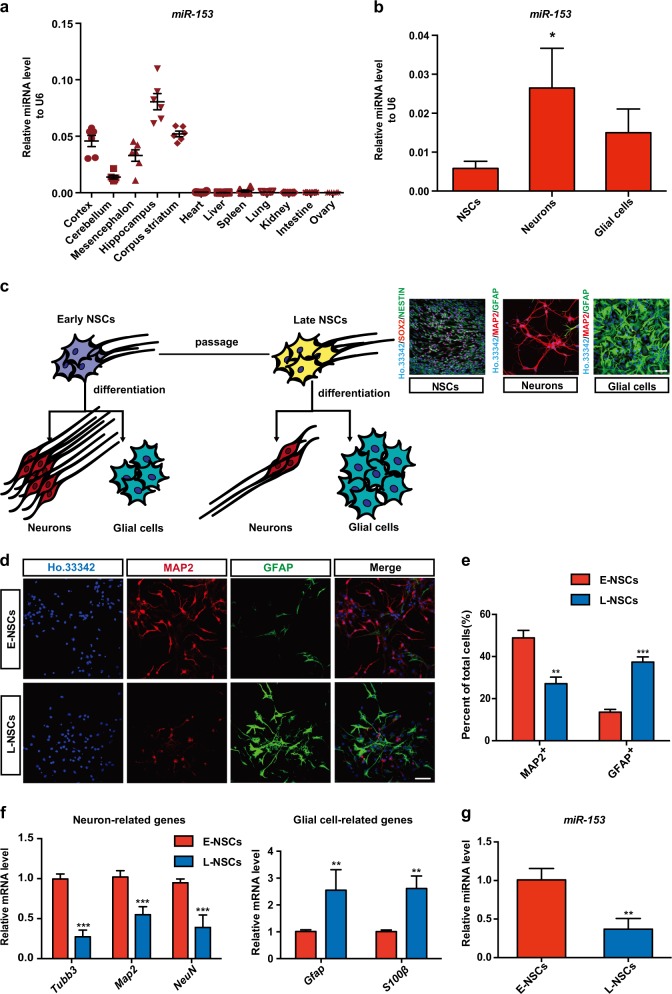
miR-153 is abundantly expressed in neural tissues and downregulated with neurogenesis decreased. a Quantitative RT-PCR detection of miR-153 in different mouse tissues, n = 6. b Quantitative RT-PCR detection of miR-153 in neural stem cells (NSCs), neurons, and glial cells; immunostaining images of SOX2 (red), NESTIN (green), and Ho.33342 (blue) in NSCs and of the neuron marker MAP2 (red), the glial cell marker GFAP (green), and Ho.33342 (blue) in neurons and glial cells are shown. Scale bar: 50 μm. c Model of neural differentiation: early NSCs (E-NSCs) exhibited a high level of differentiation into neurons, while late NSCs (L-NSCs) differentiated into fewer neurons. d Representative images showing staining for MAP2 (red), GFAP (green), and Ho.33342 (blue) to evaluate neuron differentiation. Scale bar: 50 μm. e Percentage of MAP2-positive and GFAP-positive cells in neural differentiation. f Quantitative RT-PCR detection of neuron-related genes (Tubb3, Map2, NeuN) and glial cell-related genes (Gfap, S100β) in the neural differentiation of E-NSCs and L-NSCs. g Quantitative RT-PCR detection of miR-153 in E-NSCs and L-NSCs. Data information: the data shown are the mean ± SEM, n = 3; ANOVA; ***p < 0.001, **p < 0.01, *p < 0.05. Gapdh or U6 was used as an internal control for normalization in quantitative RT-PCR

