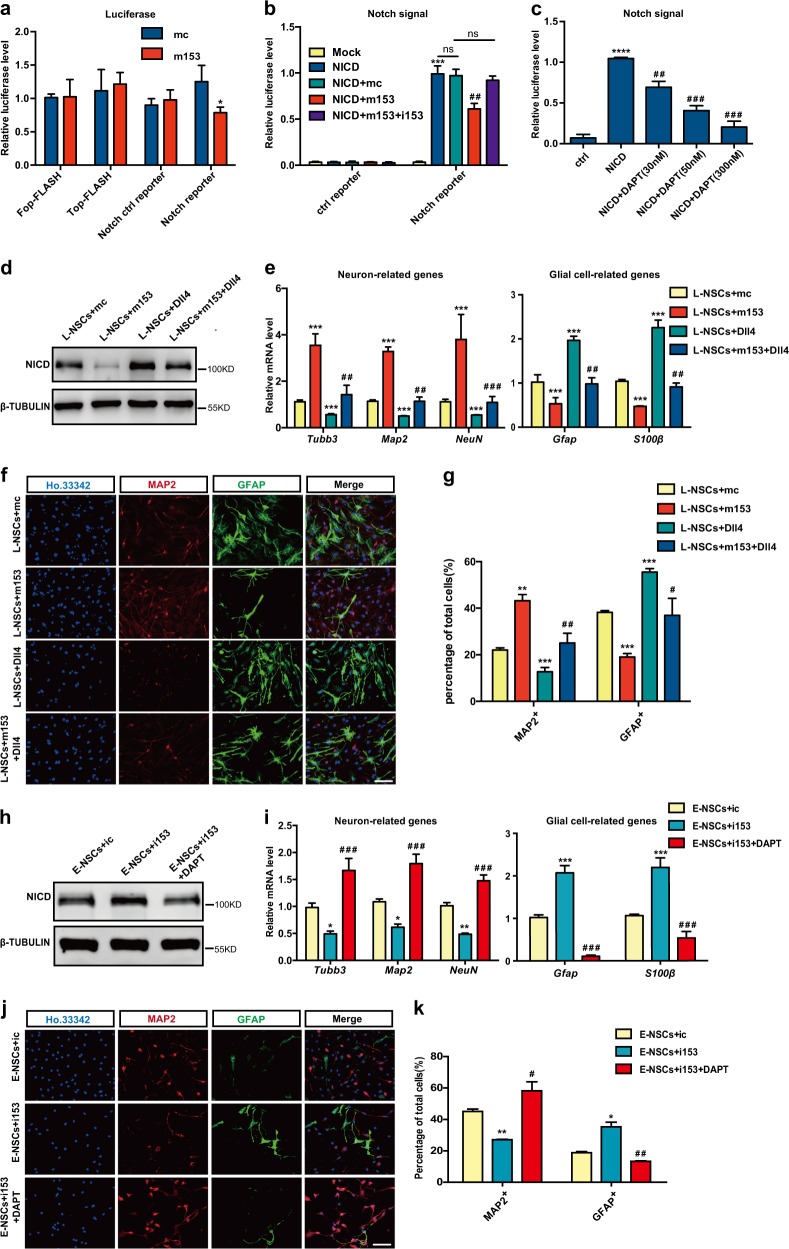
Fig. 3.
Neurogenesis is regulated by miR-153 through the Notch signaling pathway. a Relative luciferase activities of the Wnt reporter TOP-FLASH and the Notch reporter in the mc and m153 groups; FOP-FLASH was used as the negative ctrl of the Wnt reporter. b Relative luciferase activities of the Notch reporter in the mc and m153 groups; NICD is the active form of the Notch reporter. The data shown are the mean ± SEM, n = 3; ANOVA; ***p < 0.001, ##p < 0.01, “*” means compared with the mock group, “#” means compared with the NICD group. c Experiment to positively detect Notch signaling pathway activity. The data shown are the mean ± SEM, n = 3; ANOVA; ****p < 0.0001, ###p < 0.001, ##p < 0.01, “*” means compared with the mc group, “#” means compared with the NICD group. d Western blot analysis of NICD expression in the L-NSCs + mc, L-NSCs + m153, L-NSCs + Dll4 (treated with Dll4, 5 ng/µl), and L-NSCs + m153 + Dll4 groups. e Quantitative RT-PCR detection of neuron-related genes (Tubb3, Map2, NeuN) and glial cell-related genes (Gfap, S100β) involved in neural differentiation in the L-NSCs + mc, L-NSCs + m153, L-NSCs + Dll4, and L-NSCs + m153 + Dll4 groups. f Immunofluorescence analysis of the neural differentiation in the L-NSCs + mc, L-NSCs + m153, L-NSCs + Dll4, and L-NSCs + m153 + Dll4 groups as evaluated with MAP2 (red), GFAP (green) and Ho.33342 (blue). Scale bar: 50 μm. g Percentages of MAP2+ and GFAP+ cells in neural differentiation. h Western blot analysis of NICD expression in the E-NSCs + ic, E-NSCs + i153, E-NSCs + DAPT (treated with DAPT, 50 nM) and E-NSCs + i153 + DAPT groups. i Quantitative RT-PCR detection of neuron-related genes and glial cell-related genes in the neural differentiation of the E-NSCs + ic, E-NSCs + i153, E-NSCs + DAPT, and E-NSCs + i153 + DAPT groups. j Immunofluorescence analysis of the neural differentiation of E-NSCs + ic, E-NSCs + i153, E-NSCs + DAPT, and E-NSCs + i153 + DAPT as evaluated with MAP2 (red), GFAP (green), and Ho.33342 (blue). Scale bar: 50 μm. k Percentages of MAP2-positive and GFAP-positive cells in neural differentiation. Data information: the data shown are the mean ± SEM, n = 3; ANOVA; ***/###p < 0.001, **/##p < 0.01, */#p < 0.05; “*” means compared with the mc or ic group, “#” means compared with the m153 or i153 group in e, g, i, k. Gapdh was used as an internal control for the normalization in quantitative RT-PCR. L-NSCs late NSCs, E-NSCs early NSCs, mc control mimics, m153 miR-153 mimics, ic control inhibitor, i153 miR-153 inhibitor

