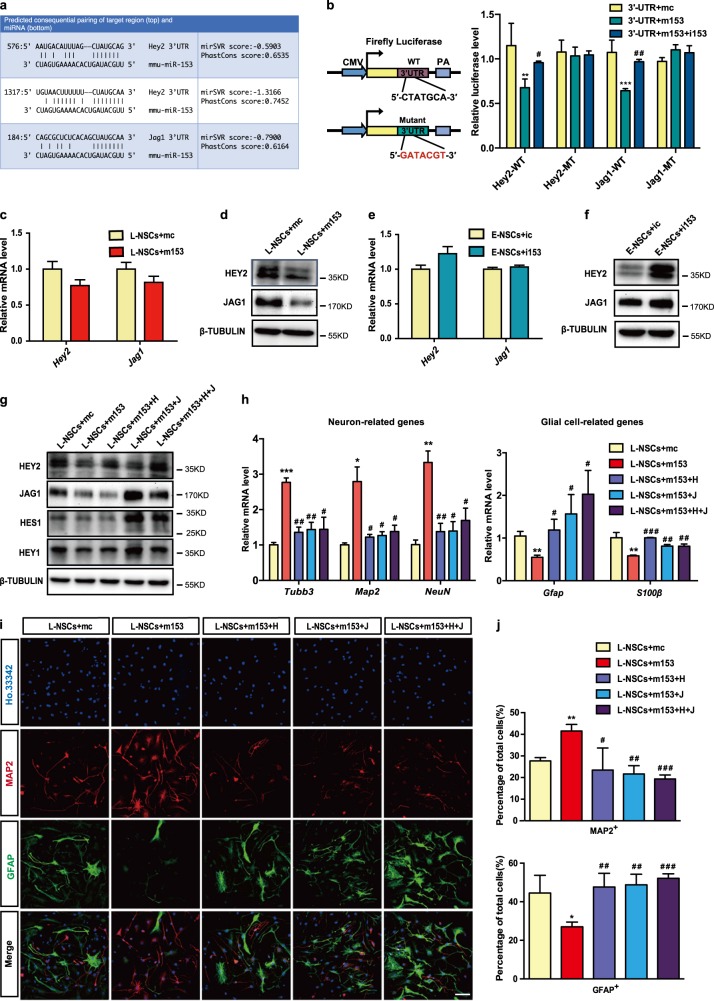
Fig. 4.
Dual regulatory effects of miR-153 on Jag1 and Hey2 in neurogenesis. a Summary of the miR-153 target sites in the 3′UTRs of Jag1 and Hey2. In the double strands of the sequence, the upper strand is miR-153, and the lower strand is the binding site of the 3′UTR mRNA. b MiR-153 specifically represses its targets in the luciferase assay. WT-UTR indicates the WT 3’UTR. MT-UTR indicates the 3′UTR containing the mutant binding site of miR-153. c Quantitative RT-PCR detection of Jag1 and Hey2 in the L-NSCs + mc and L-NSCs + m153 groups. d Western blot analysis of the protein levels of JAG1 and HEY2 in the L-NSCs + mc and L-NSCs + m153 groups normalized to β-TUBULIN. e Quantitative RT-PCR detection of Jag1 and Hey2 in the E-NSCs + ic and E-NSCs + i153 groups. f Western blot analysis of the protein levels of JAG1 and HEY2 in the E-NSCs + ic and E-NSCs + i153 groups normalized to β-TUBULIN. g Western blot analysis of the protein levels of HEY2, JAG1, HEY1, and HES1 in rescue experiments normalized to β-TUBULIN. h Quantitative RT-PCR detection of neuron-related genes and glial cell-related genes in the neural differentiation of the L-NSCs + mc, L-NSCs + m153, L-NSCs + m153 + H, L-NSCs + m153 + J and L-NSCs + m153 + H + J groups. i Immunofluorescence analysis of neural differentiation by means of MAP2 (red), GFAP (green), and Ho.33342 (blue). Scale bar: 50 μm. j Percentages of MAP2-positive and GFAP-positive cells in neural differentiation. Data information: the data shown are the mean ± SEM, n = 3; ANOVA; ***/###p < 0.001, **/##p < 0.01, */#p < 0.05; “*” means compared with the mc group, and “#” means compared with the m153 group. Gapdh was used as an internal control for the normalization in quantitative RT-PCR. L-NSCs late NSCs, E-NSCs early NSCs, mc control mimics, m153 miR-153 mimics, ic control inhibitor, i153 miR-153 inhibitor, H Hey2, J Jag1

