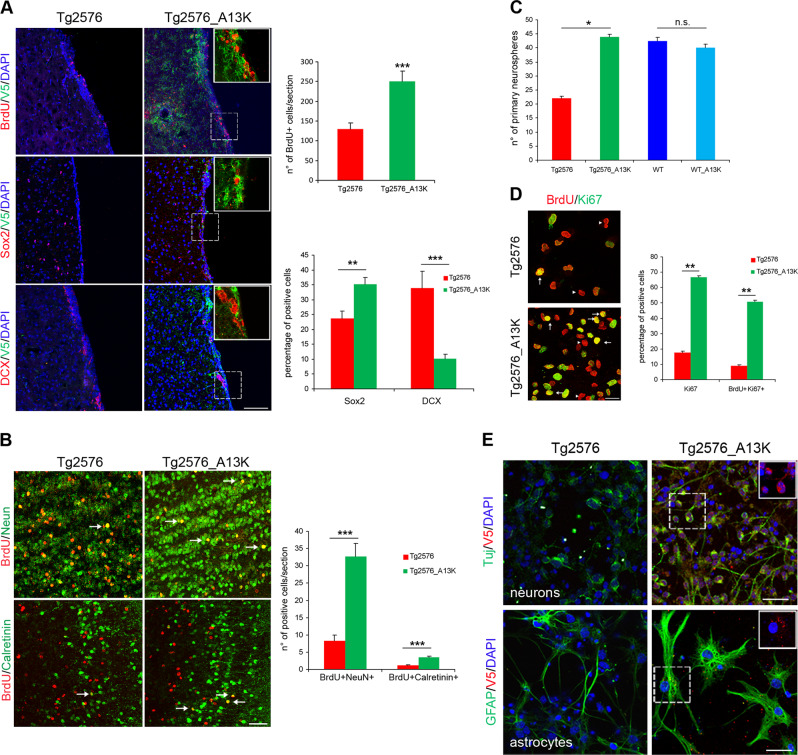
Fig. 6.
In vivo rescue of Tg2576 impaired neurogenesis by scFvA13-KDEL lentiviral infection. a Lentiviral delivery of scFvA13-KDEL intrabody to Tg2576 SVZ. The intrabody expression, confirmed by immunofluorescence staining for its C-terminal tag V5 (in green, right panels), leads to a significant rescue of proliferation, demonstrated by the increased number of BrdU+ cells (red signal), and restores the correct number of progenitors (Sox2+, red signal in central right panel) and neuroblasts (DCX+, red signal in bottom right panel) in the infected SVZ. DAPI staining on nuclei in blue. Scale bar 75 µm, ×40 magnification. White squared boxes in top panels represent ×2.5 magnification of the corresponding dot-lines insets. The histograms represent the quantification of BrdU or of Sox2 and DCX positive cells in Tg2576 (red) and Tg2576_A13K (green) SVZ. b Immunostaining for BrdU and NeuN (red and green, respectively, top panels) and BrdU and Calretinin (red and green, respectively, bottom panels) in the OB of infected animals shows a significant increase of newborn Calretinin interneurons derived from Tg2576_A13K SVZ progenitors compared with Tg2576, as quantified in the histogram. Scale bar 50 µm, ×40 magnification. c Quantification of the number of primary neurospheres derived from Tg2576 (red) and Tg2576_A13K (green) SVZ show ex-vivo rescue of proliferation by the in vivo intrabody expression. d Immunofluorescence staining for BrdU and Ki67 (red and green signals, respectively, in left panels), showing more BrdU+ (arrowheads) and double BrdU+Ki67+ (arrows) cells in Tg2576_A13K samples compared wth their noninfected counterpart. DAPI staining on nuclei in blue. Scale bar 25 µm, ×63 magnification. e Immunofluorescence staining for neurons (TuJ1, green signal in upper panels) and astrocytes (GFAP, green signal in lower panels) shows that the expression of scFvA13 intrabody (V5+ cells, red signal) leads to a partial rescue of both the neuronal arborization and the dystrophic cellular shape of astrocytes. DAPI staining on nuclei in blue. Scale bar 25 μm, ×63 magnification, zoom 1.5. White squared boxes represent only the V5 signal (in red) of the corresponding cells dot-lines insets. Data are means ± SEM of five individual animals (n = 5) for each experimental group. *P < 0.05, **P < 0.01, ***P < 0.001, significantly different from Tg2576, Mann-Whitney test. n.s., not significantly different from WT, Mann-Whitney test

