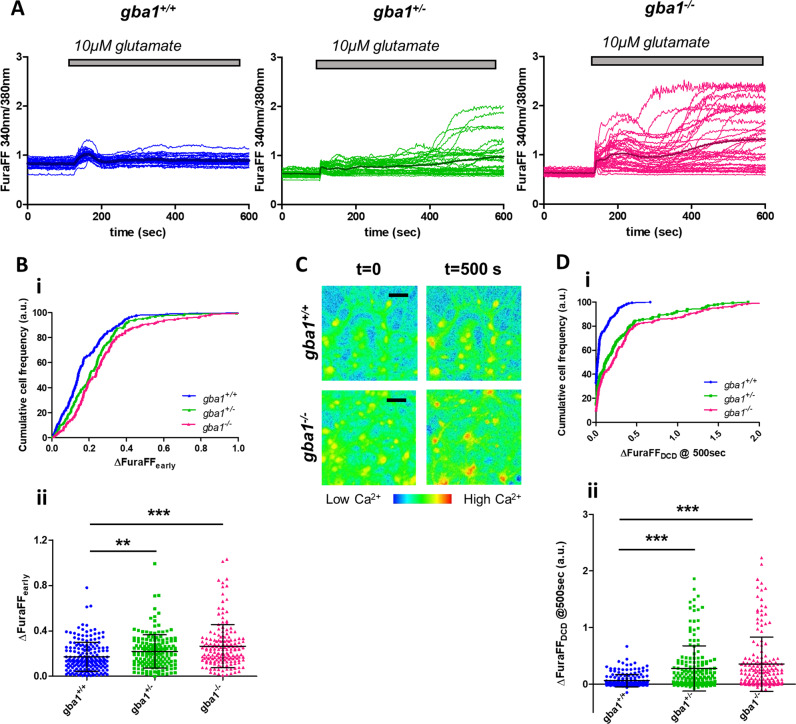
Fig. 1.
Gba1+/− and gba1−/− neurons show delayed calcium deregulation in response to low glutamate concentrations. a Neuronal cytosolic calcium concentration was measured by fluorescence imaging after labeling neurons with the low-affinity calcium sensor, FuraFF. Changes in [Ca2+]c following exposure of neurons to 10 μM glutamate are plotted as a function of time for the different genotypes gba1+/+, gba1+/−, and gba1−/−, as indicated. The traces reveal a significant difference between the responses of each genotype upon 10 μM glutamate stimulation both in term of the immediate response, which was followed by delayed calcium deregulation (DCD) in a large proportion of gba1−/− and a smaller but significant number of gba1+/− cells (n = 3 independent experiments, N = 40–60 cells per genotype per experiment). b (i) The graphs show the cumulative frequency distribution of the peak values of the early response (at about 100 s) to 10 μM glutamate for the different genotypes and (ii) scatter plots of the peak values and mean ± SD. The data show a significant increase in [Ca2+]c in the early response to glutamate in gba1+/− or gba1−/− compared with gba1+/+ (Kruskal–Wallis test, Dunns post-test, **p < 0.01 and ***p < 0.001, respectively). c FuraFF ratiometric images for gba1+/+ and gba1−/− neurons (the image excited at 340 nm divided by that excited at 380 nm), shown at the start of the experiment (t = 0 s) and at 400 s after exposure to glutamate, showing that [Ca2+]c had fully recovered in the control neurons, while the sustained very high [Ca2+]c levels in the gba1−/− neurons reflect deregulation of [Ca2+]c homeostasis and DCD (scale bar = 25 µ). d (i) Cumulative frequency distribution of the peak values of DCD (400 s after stimulation) in response to 10 μM glutamate for the different genotypes and (ii) relative scatter plots of the peak values and mean ± SD. These data show the increased percentage of neurons showing DCD (ΔFuraFF > 0.1) in gba1+/− or gba1−/− cells compared with gba1+/+ (Kruskal–Wallis test, Dunns post-test, ***p < 0.001)

