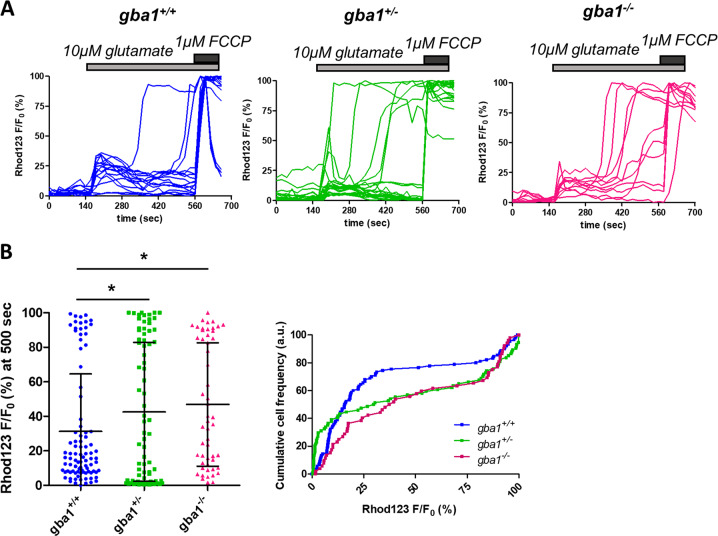
Fig. 3.
Low glutamate concentrations cause mitochondrial depolarization in gba1+/− and gba1−/− neurons. a The mitochondrial membrane potential was measured using rhodamine 123 (with the ‘dequench protocol’) in responses to exposure to 10 μM glutamate stimulation and plotted as a function of time for each genotype gba1+/+, gba1+/−, and gba1−/−. An increase in Rhod123 fluorescence intensity reports mitochondrial depolarization. The responses to 10 μM glutamate were significantly different between gba1−/− and gba1+/+ or gba1+/− genotypes, revealing a large depolarization in the gba1−/− and in gba+/− cells (n = 3 biological replicates, N = 15–25 cells per genotype per experiment). b Scatter plots of the mitochondrial depolarization at 360 s after 10 μM glutamate stimulation, expressed as Rhod123 F/F0 percentage comprised between the baseline (0%) and maximal fluorescence intensity value (100%) for the different genotypes. Average values are expressed as mean ± SD (left panel). Relative cumulative frequency distribution of the mitochondrial depolarization is also shown (right panel), showing a significant mitochondrial depolarization in response to 10 μM glutamate in gba1+/− or gba1−/− compared with gba1+/+ (Kruskal–Wallis test, Dunns post-test, *p < 0.05)

