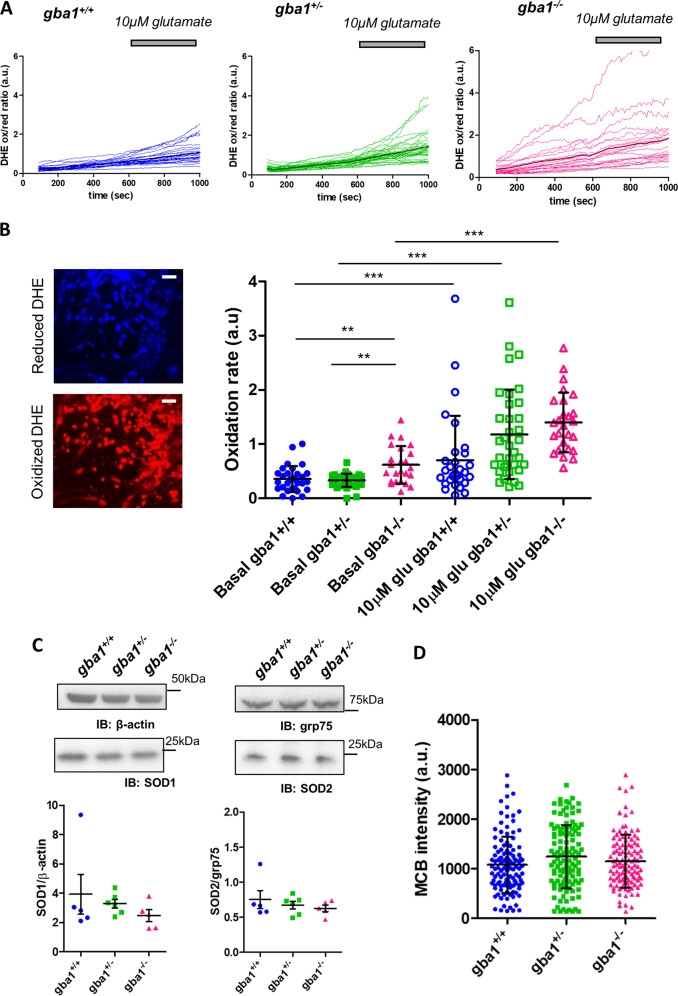
Fig. 6.
Rates of free radical production are increased in gba1−/− neurons. a The rate of oxidation of Dihydroethidium (DHE) to a red fluorescent product was used to measure the rate of free radical generation with time in live cells. This was calculated as the intensity ratio between the oxidized (red) and the reduced (blue) forms DHE (shown as red and blue in the fluorescence images, respectively), under basal conditions and after 10 μM glutamate stimulation. b Representative confocal images of oxidized and reduced DHE in cells (scale bar = 25 μm). Representative DHE oxidation rates quantification as measured from the slopes of the curves showing DHE oxidation over time, before and after 10 μM glutamate stimulation for gba1+/+, gba1+/−, and gba1−/− cells (data shown as scatter plots and mean ± SD, n = 3 independent experiments, N = 15–30 cells per genotype per experiment, Kruskal–Wallis test, Dunns post-test, **p < 0.01 and ***p < 0.001). c Western blot analysis of the expression levels of antioxidant proteins SOD1 and SOD2 (data shown as scatter plots and mean ± SEM, n = 5–6 brains per genotype) normalized to beta-actin and grp75, respectively. The scatter plot showing the result for protein expression suggests that there was no significant difference among the different genotypes (One-way Anova, post-hoc Bonferroni). d Glutathione levels were measured by imaging MCB intensity for neurons from each of the three genotypes (data shown as scatter plots and mean ± SD, n = 3 independent experiments, N = 35–40 per genotype per experiment). No significant difference was observed (Kruskal–Wallis test, Dunns post-test)

