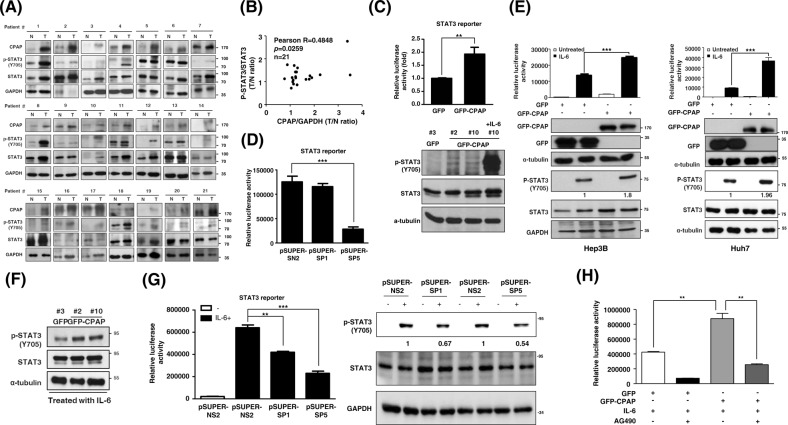
Fig. 3.
CPAP enhances STAT3 activity in HCC. a, b Immunoblotting analysis showed the expression of CPAP, p-STAT3, and STAT3 in paired HCC tumor (T) and adjacent nontumor tissues (N) (a). A total of twenty-one paired HCC specimens were analyzed. GAPDH was used as a loading control. A positive correlation between CPAP and p-STAT3 expression is shown (b). Pearson correlation coefficient, R = 0.4848, p = 0.0259. c (Upper) STAT3 transcriptional activity was determined in GFP- or GFP-CPAP-expressing Hep3B cells by a STAT3-driven luciferase reporter assay. STAT3 transcriptional activity is shown in relative luciferase activity as a fold change. (Lower) The level of phosphor-STAT3/Y705 (p-STAT3/Y705) in GFP/Hep3B or GFP-CPAP/Hep3B stable cells under normal culture conditions was determined by Western blot analysis. IL-6-treated GFP-CPAP/Hep3B cells were used as a positive control to detect p-STAT3/Y705. α-tubulin was used as a loading control. d STAT3 transcriptional activity in CPAP-knocked-down cells was determined by STAT3-driven luciferase reporter assay as described above. e GFP- or GFP-CPAP-expressing Hep3B or Huh7 cells were serum starved and then treated with (■) or without (□) IL-6 (25 ng/ml) for 6 h to determine the transcriptional activity of STAT3 by reporter assay as described above. Western blot analysis showed the expression of the indicated proteins. f Total lysates of GFP/Hep3B or GFP-CPAP/Hep3B stable cells treated with 25 ng/ml IL-6 for 10 min were collected for Western blot as described above. g CPAP-knocked-down Hep3B cells were treated with (■) or without (□) IL-6 to determine STAT3 activity by reporter assay (left) or Western blot analysis (right) as described above. h After serum starvation, GFP/Hep3B or GFP-CPAP/Hep3B cells were pretreated with (+) or without (−) 200 μM AG490 for 30 min and then treated with 25 ng/ml IL-6 for 6 h. STAT3 transcriptional activity was then determined by a STAT3-driven luciferase reporter assay. Student’s t test, *p < 0.05, **p < 0.01, ***p < 0.001

