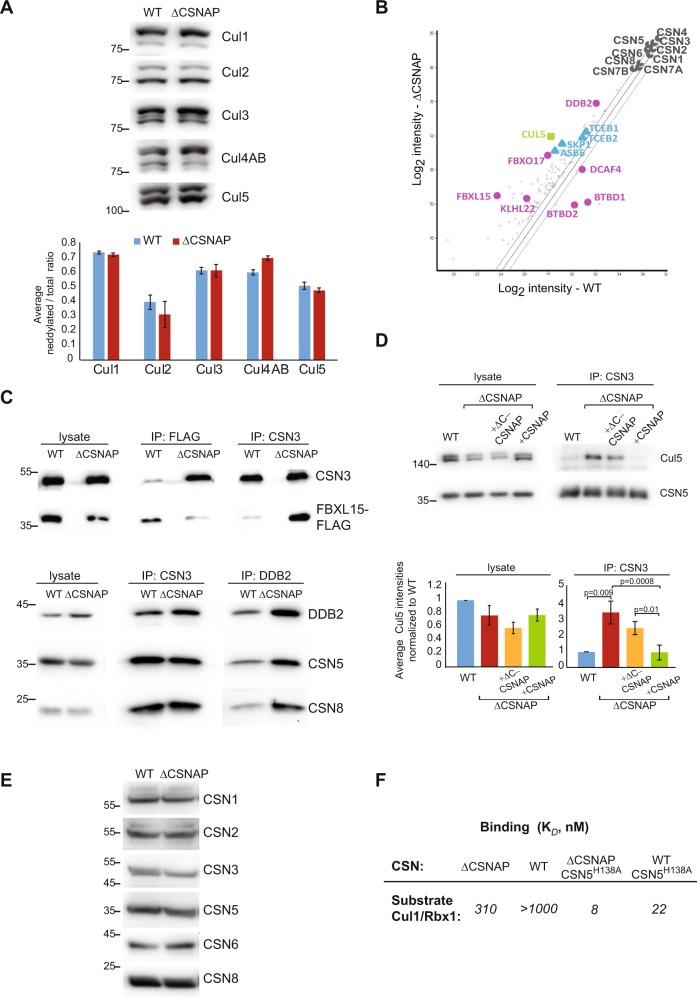
Fig. 1.
CSNAP modifies the strength of CSN-CRL interactions. a CSN catalytic activity is not significantly affected by the absence of CSNAP. A representative western blot of WT and ΔCSNAP cell extracts visualized using antibodies against various cullins (top) and a plot demonstrating the average deneddylated fraction. The graph represents the averages of three independent experiments, with standard errors. b CSN and its interacting proteins were pulled down using an antibody against CSN3 from WT and ΔCSNAP cells. Immunoprecipitated proteins were then analyzed by label-free proteomics approach using three biological replicates. Scatter plot comparing log2 intensities of proteins in ΔCSNAP and WT samples show that a number of CRL proteins were found to be over- or underrepresented in the pulldown of the CSN and CSNΔCSNAP complexes. In contrast, the ratio of average intensities for CSN subunits did not exceed the fold change of ΔCSNAP/WT > 1.5, which was considered to be the cutoff for fold change. c Validation of the proteomics data for FBXL15/CSN and DDB2/CSN interactions. Reciprocal immunoprecipitation shows a tighter CSN3 interaction with FBXL15 and DDB2, in the absence of CSNAP. The immunoprecipitated proteins were detected by western blot, using the relevant antibodies. Densitometry analysis of three independent experiments is shown in Fig. S1a. d Validation of the proteomics data for Cul5/CSN interaction. Immunoprecipitation using anti-CSN3 shows stronger interaction in the absence of CSNAP or its C-terminal interacting domain, while overexpression of full-length CSNAP in ΔCSNAP cells rescues the weaker Cul5/CSN interaction, characteristic to WT cells. Due to the lack of appropriate antibody reciprocal immunoprecipitation could not be performed. The densitometry analysis shows the average Cul5 intensities normalized to WT from three independent experiments with standard errors, significance was calculated using two-way ANOVA accounting for treatment and batch (p = 0.000469) followed by Tukey’s post hoc test. e The levels of CSN subunits are comparable in WT and ΔCSNAP cells (30 μg total protein loaded); thus, the differences in the amount of the pulled-down proteins are likely due to different interaction affinities. Representative blot out of three repeats. f Determination of the dissociation constant (Kd) for the CSN and CSNΔCSNAP complexes, and dansyl-labeled Cul1-Nedd8/Rbx1. The absence of CSNAP causes tighter binding to cullin1/Rbx1

