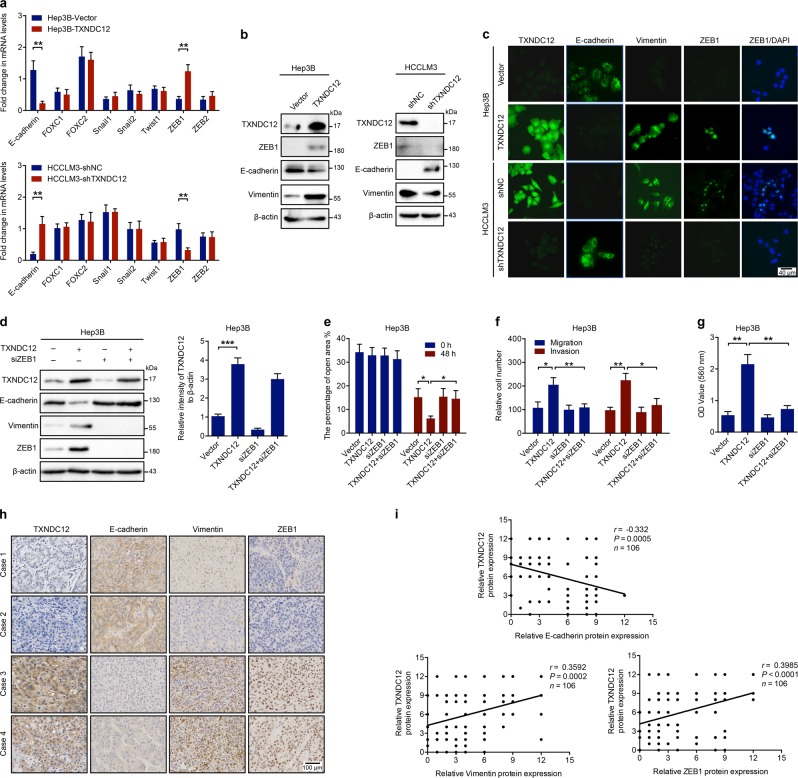
Fig. 3.
TXNDC12 promotes EMT in HCC cells via upregulation of ZEB1. a Fold change in the mRNA levels of E-cadherin, FOXC1, FOXC2, Snail1, Snail2, Twist1, ZEB1, and ZEB2 in the indicated cells. The data are the means ± SDs and are representative of three independent experiments. b Relative expression levels of TXNDC12, ZEB1, E-cadherin, and Vimentin in the indicated cells. c TXNDC12, E-cadherin, Vimentin, and ZEB1 expression in the indicated cells, as detected by an immunofluorescence assay. The merged images show overlays of ZEB1 (green) and nuclear staining by DAPI (blue); scale bar: 40 mm. d Relative expression levels of TXNDC12, E-cadherin, Vimentin, and ZEB1 in the indicated cells treated with or without siZEB1. e Wound healing migration assays performed with the indicated HCC cells treated with or without siZEB1. The data are the means ± SDs and are representative of three independent experiments. f Transwell migration and Matrigel invasion assays performed with the indicated HCC cells treated with or without siZEB1. The data are the means ± SDs and are representative of three independent experiments. g Representative data from the cell adhesion assay performed with the indicated HCC cells treated with or without siZEB1. The data are the means ± SDs and are representative of three independent experiments. h Representative immunohistochemical staining of TXNDC12, E-cadherin, Vimentin, and ZEB1 in human HCC tissues; scale bar: 40 μm. i Correlation analysis between TXNDC12 and E-cadherin, Vimentin or ZEB1 expression in liver tumor tissues from patients with HCC (n = 106). *P < 0.05; **P < 0.01

