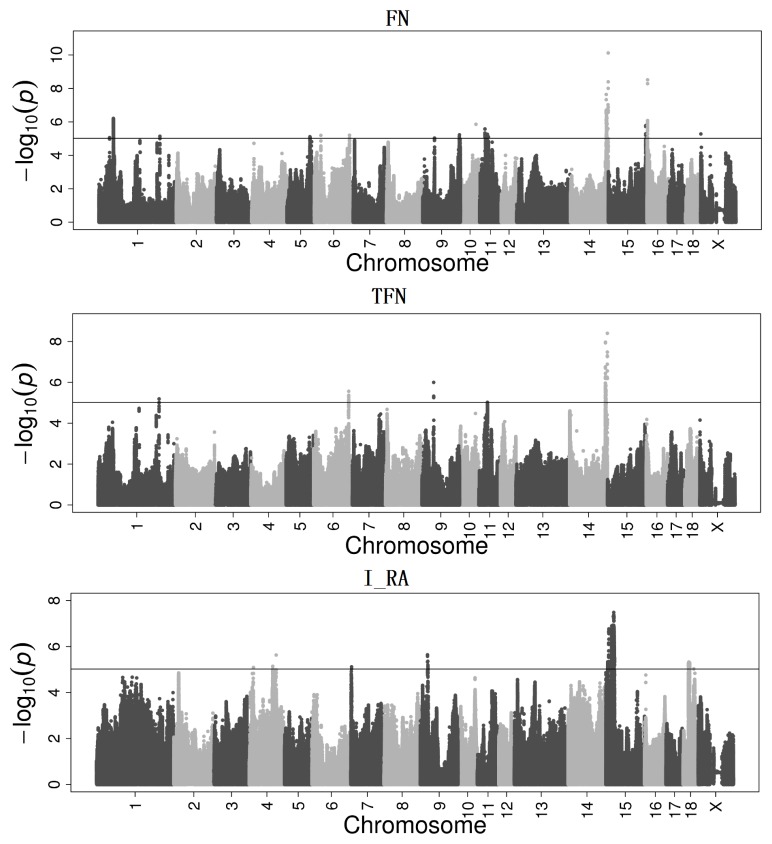
Figure 2.
The related Manhattan plots of GWAS results for muscle fiber traits. The x-axis and y-axis respectively represent the genomic positions separated by chromosomes and the –log10 (p-value) of the SNPs, different chromosomes are separated by gray and black colors, the black solid lines indicate the chromosome significance threshold. GWAS, genome-wide association studies; SNPs, single nucleotide polymorphisms; FN, fiber number per square centimeter; TFN, total fiber number; I_RA, relative area of fiber type I.

