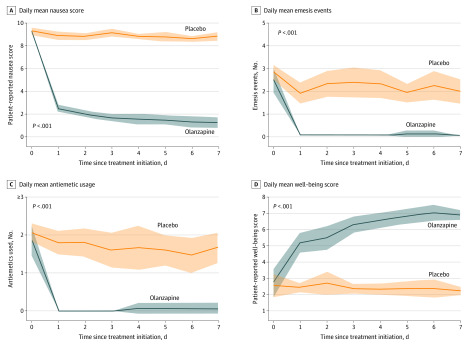
Figure 2. Plots of Daily Data Over Time.
Plots with 95% CIs, regarding daily data during the study period for numeric rating score (NRS) for nausea (A), the number of emetogenic episodes per day (B), the number of rescue antiemetic doses per day (C), and NRS for well-being (D). In some plots, lower scores are better, while higher scores are better in others; in all situations, the olanzapine arm had more favorable results. The provided P values are from the Wilcoxon test in which change from baseline to day 7 was tested between arms.

